1. interoperability-embedded-python
This proof of concept aims to show how the iris interoperability framework can be used with embedded python.
1.1. Table of Contents
1.2. Example
from grongier.pex import BusinessOperation,Message

class MyBusinessOperation(BusinessOperation):

    def on_init(self):
        #This method is called when the component is becoming active in the production

        self.log_info("[Python] ...MyBusinessOperation:on_init() is called")

        return

    def on_teardown(self):
        #This method is called when the component is becoming inactive in the production

        self.log_info("[Python] ...MyBusinessOperation:on_teardown() is called")

        return

    def on_message(self, message_input:MyRequest):
        # called from service/process/operation, message is of type MyRequest with property request_string

        self.log_info("[Python] ...MyBusinessOperation:on_message() is called with message:"+message_input.request_string)

        response = MyResponse("...MyBusinessOperation:on_message() echos")

        return response

@dataclass
class MyRequest(Message):

    request_string:str = None

@dataclass
class MyResponse(Message):

    my_string:str = None
1.3. Register a component
Thanks to the method grongier.pex.Utils.register_component() :
Start an embedded python shell :
/usr/irissys/bin/irispython
Then use this class method to add a python class to the component list for interoperability.
from grongier.pex import Utils

Utils.register_component(<ModuleName>,<ClassName>,<PathToPyFile>,<OverWrite>,<NameOfTheComponent>)
e.g :
from grongier.pex import Utils

Utils.register_component("MyCombinedBusinessOperation","MyCombinedBusinessOperation","/irisdev/app/src/python/demo/",1,"PEX.MyCombinedBusinessOperation")
This is a hack, this not for production.
2. Demo
The demo can be found inside src/python/demo/reddit/ and is composed of :
An adapter.py file that holds a RedditInboundAdapter that will, given a service, fetch Reddit recent posts.
A bs.py file that holds three services that does the same thing, they will call our Process and send it reddit post. One work on his own, one use the RedditInBoundAdapter we talked about earlier and the last one use a reddit inbound adapter coded in ObjectScript.
A bp.py file that holds a FilterPostRoutingRule process that will analyze our reddit posts and send it to our operations if it contains certain words.
A bo.py file that holds :
- Two email operations that will send a mail to a certain company depending on the words analyzed before, one works on his own and the other one works with an OutBoundAdapter.
- Two file operations that will write in a text file depending on the words analyzed before, one works on his own and the other one works with an OutBoundAdapter.
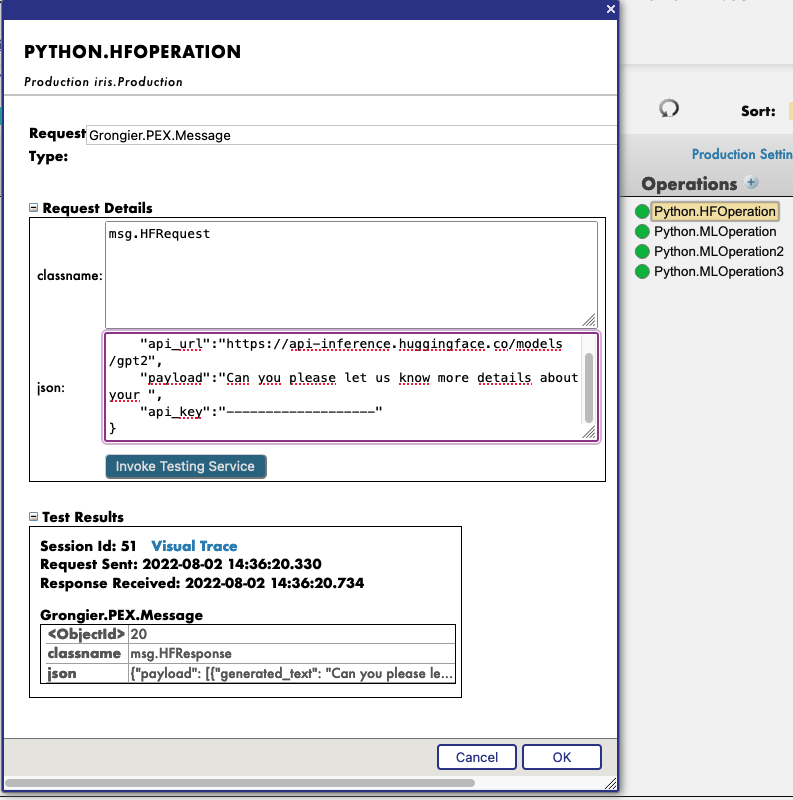
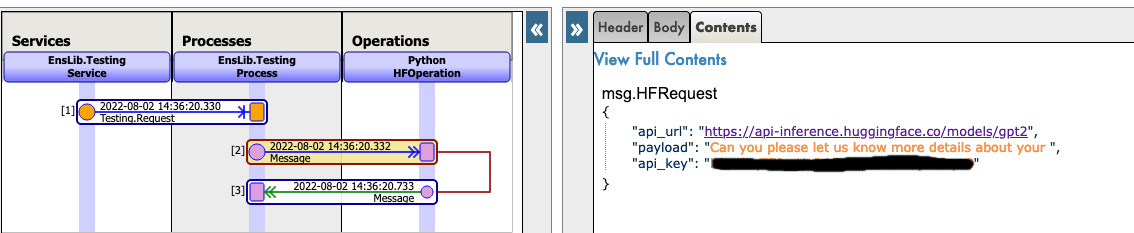
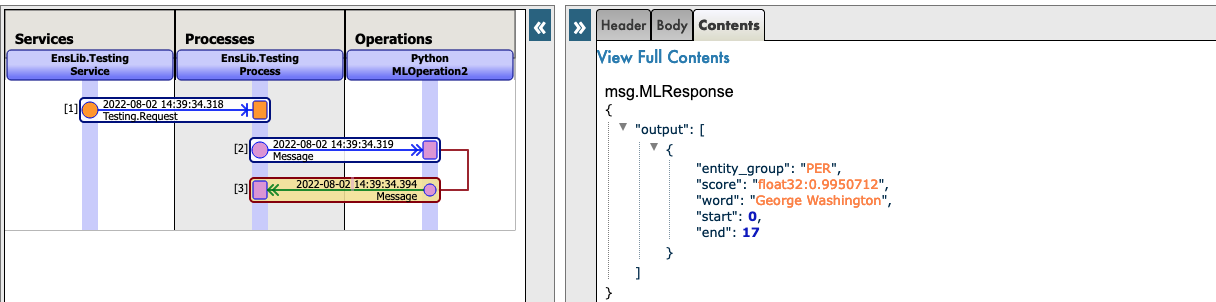
New json trace for python native messages :
3. Prerequisites
Make sure you have git and Docker desktop installed.
4. Installation
4.1. With Docker
Clone/git pull the repo into any local directory
git clone https://github.com/grongierisc/interpeorability-embedded-python
Open the terminal in this directory and run:
docker-compose build
Run the IRIS container with your project:
docker-compose up -d
4.2. Without Docker
Install the grongier_pex-1.2.4-py3-none-any.whl on you local iris instance :
/usr/irissys/bin/irispython -m pip install grongier_pex-1.2.4-py3-none-any.whl
Then load the ObjectScript classes :
do $System.OBJ.LoadDir("/opt/irisapp/src","cubk","*.cls",1)
4.3. With ZPM
zpm "install pex-embbeded-python"
4.4. With PyPI
pip3 install iris_pex_embedded_python
Import the ObjectScript classes, open an embedded python shell and run :
from grongier.pex import Utils
Utils.setup()
4.4.1. Known issues
If the module is not updated, make sure to remove the old version :
pip3 uninstall iris_pex_embedded_python
or manually remove the grongier folder in <iris_installation>/lib/python/
or force the installation with pip :
pip3 install --upgrade iris_pex_embedded_python --target <iris_installation>/lib/python/
5. How to Run the Sample
5.1. Docker containers
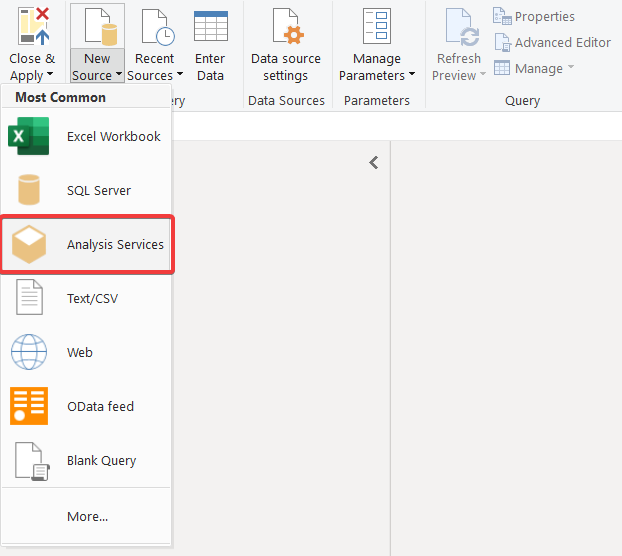
In order to have access to the InterSystems images, we need to go to the following url: http://container.intersystems.com. After connecting with our InterSystems credentials, we will get our password to connect to the registry. In the docker VScode addon, in the image tab, by pressing connect registry and entering the same url as before (http://container.intersystems.com) as a generic registry, we will be asked to give our credentials. The login is the usual one but the password is the one we got from the website.
From there, we should be able to build and compose our containers (with the docker-compose.yml and Dockerfile files given).
5.2. Management Portal and VSCode
This repository is ready for VS Code.
Open the locally-cloned interoperability-embedeed-python folder in VS Code.
If prompted (bottom right corner), install the recommended extensions.
IMPORTANT: When prompted, reopen the folder inside the container so you will be able to use the python components within it. The first time you do this it may take several minutes while the container is readied.
By opening the folder remote you enable VS Code and any terminals you open within it to use the python components within the container. Configure these to use /usr/irissys/bin/irispython

5.3. Open the production
To open the production you can go to production.
You can also click on the bottom on the 127.0.0.1:52773[IRISAPP] button and select Open Management Portal then, click on [Interoperability] and [Configure] menus then click [productions] and [Go].
The production already has some code sample.
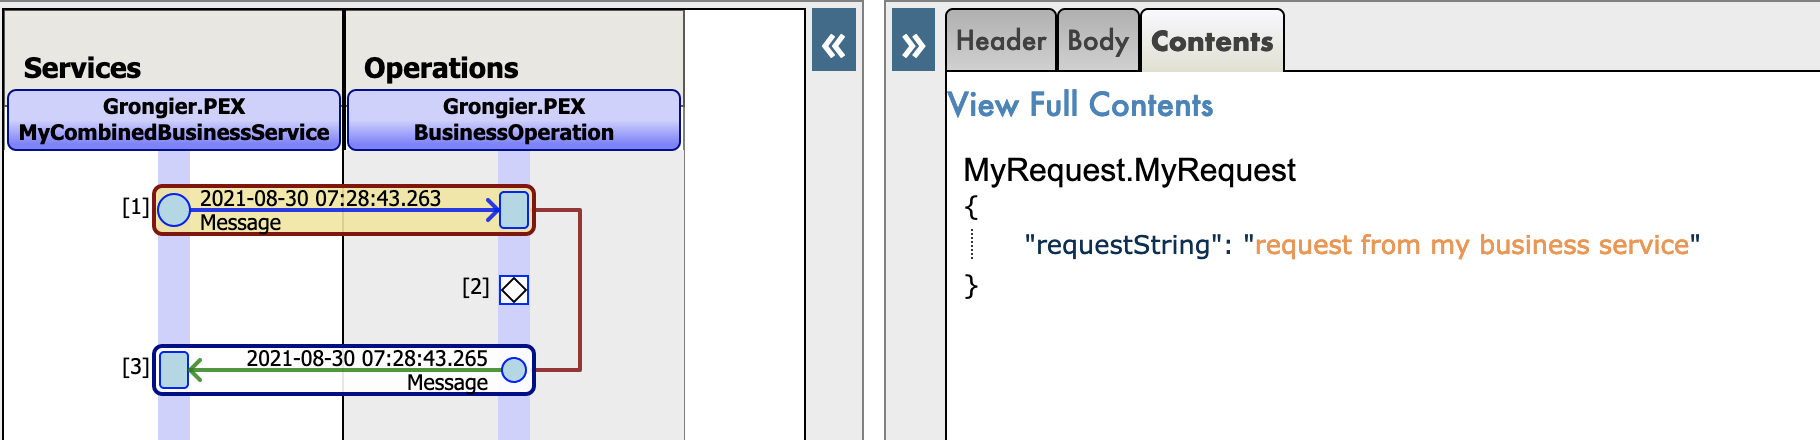
Here we can see the production and our pure python services and operations:

New json trace for python native messages :
6. What's inside the repository
6.1. Dockerfile
A dockerfile which install some python dependancies (pip, venv) and sudo in the container for conviencies.
Then it create the dev directory and copy in it this git repository.
It starts IRIS and activates %Service_CallIn for Python Shell.
Use the related docker-compose.yml to easily setup additional parametes like port number and where you map keys and host folders.
This dockerfile ends with the installation of requirements for python modules.
Use .env/ file to adjust the dockerfile being used in docker-compose.
6.2. .vscode/settings.json
Settings file to let you immedietly code in VSCode with VSCode ObjectScript plugin
6.3. .vscode/launch.json
Config file if you want to debug with VSCode ObjectScript
Read about all the files in this article
6.4. .vscode/extensions.json
Recommendation file to add extensions if you want to run with VSCode in the container.
More information here

This is very useful to work with embedded python.
6.5. src folder
src
├── Grongier
│   └── PEX // ObjectScript classes that wrap python code
│       ├── BusinessOperation.cls
│       ├── BusinessProcess.cls
│       ├── BusinessService.cls
│       ├── Common.cls
│       ├── Director.cls
│       ├── InboundAdapter.cls
│       ├── Message.cls
│       ├── OutboundAdapter.cls
│       ├── Python.cls
│       ├── Test.cls
│       └── _utils.cls
├── PEX // Some example of wrapped classes
│   └── Production.cls
└── python
    ├── demo // Actual python code to run this demo
    |   `-- reddit
    |       |-- adapter.py
    |       |-- bo.py
    |       |-- bp.py
    |       |-- bs.py
    |       |-- message.py
    |       `-- obj.py
    ├── dist // Wheel used to implement python interoperability components
    │   └── grongier_pex-1.2.4-py3-none-any.whl
    ├── grongier
    │   └── pex // Helper classes to implement interoperability components
    │       ├── _business_host.py
    │       ├── _business_operation.py
    │       ├── _business_process.py
    │       ├── _business_service.py
    │       ├── _common.py
    │       ├── _director.py
    │       ├── _inbound_adapter.py
    │       ├── _message.py
    │       ├── _outbound_adapter.py
    │       ├── __init__.py
    │       └── _utils.py
    └── setup.py // setup to build the wheel
7. How it works
7.1. The __init__.pyfile
This file will allow us to create the classes to import in the code.
It gets from the multiple files seen earlier the classes and make them into callable classes.
That way, when you wish to create a business operation, for example, you can just do:
from grongier.pex import BusinessOperation
7.2. The common class
The common class shouldn't be called by the user, it defines almost all the other classes.
This class defines:
on_init: The on_init() method is called when the component is started.
Use the on_init() method to initialize any structures needed by the component.
on_tear_down: Called before the component is terminated.
Use it to free any structures.
on_connected: The on_connected() method is called when the component is connected or reconnected after being disconnected.
Use the on_connected() method to initialize any structures needed by the component.
log_info: Write a log entry of type "info". :log entries can be viewed in the management portal.
log_alert: Write a log entry of type "alert". :log entries can be viewed in the management portal.
log_warning: Write a log entry of type "warning". :log entries can be viewed in the management portal.
log_error: Write a log entry of type "error". :log entries can be viewed in the management portal.
7.3. The business_host class
The business host class shouldn't be called by the user, it is the base class for all the business classes.
This class defines:
send_request_sync: Send the specified message to the target business process or business operation synchronously.
Parameters:
- target: a string that specifies the name of the business process or operation to receive the request.
The target is the name of the component as specified in the Item Name property in the production definition, not the class name of the component. - request: specifies the message to send to the target. The request is either an instance of a class that is a subclass of Message class or of IRISObject class.
If the target is a build-in ObjectScript component, you should use the IRISObject class. The IRISObject class enables the PEX framework to convert the message to a class supported by the target. - timeout: an optional integer that specifies the number of seconds to wait before treating the send request as a failure. The default value is -1, which means wait forever.
description: an optional string parameter that sets a description property in the message header. The default is None.
Returns:
the response object from target.
Raises:
TypeError: if request is not of type Message or IRISObject.
send_request_async: Send the specified message to the target business process or business operation asynchronously.
Parameters:
- target: a string that specifies the name of the business process or operation to receive the request.
The target is the name of the component as specified in the Item Name property in the production definition, not the class name of the component. - request: specifies the message to send to the target. The request is an instance of IRISObject or of a subclass of Message.
If the target is a built-in ObjectScript component, you should use the IRISObject class. The IRISObject class enables the PEX framework to convert the message to a class supported by the target. - description: an optional string parameter that sets a description property in the message header. The default is None.
Raises:
TypeError: if request is not of type Message or IRISObject.
get_adapter_type: Name of the registred Adapter.
7.4. The inbound_adapter class
Inbound Adapter in Python are subclass from grongier.pex.InboundAdapter in Python, that inherit from all the functions of the common class.
This class is responsible for receiving the data from the external system, validating the data, and sending it to the business service by calling the BusinessHost process_input method.
This class defines:
on_task: Called by the production framework at intervals determined by the business service CallInterval property.
The message can have any structure agreed upon by the inbound adapter and the business service.
Example of an inbound adapter ( situated in the src/python/demo/reddit/adapter.py file ):
from grongier.pex import InboundAdapter
import requests
import iris
import json

class RedditInboundAdapter(InboundAdapter):
    """
    This adapter use requests to fetch self.limit posts as data from the reddit
    API before calling process_input for each post.
    """
    def on_init(self):

        if not hasattr(self,'feed'):
            self.feed = "/new/"

        if self.limit is None:
            raise TypeError('no Limit field')

        self.last_post_name = ""

        return 1

    def on_task(self):
        self.log_info(f"LIMIT:{self.limit}")
        if self.feed == "" :
            return 1

        tSC = 1
        # HTTP Request
        try:
            server = "https://www.reddit.com"
            request_string = self.feed+".json?before="+self.last_post_name+"&limit="+self.limit
            self.log_info(server+request_string)
            response = requests.get(server+request_string)
            response.raise_for_status()

            data = response.json()
            updateLast = 0

            for key, value in enumerate(data['data']['children']):
                if value['data']['selftext']=="":
                    continue
                post = iris.cls('dc.Reddit.Post')._New()
                post._JSONImport(json.dumps(value['data']))
                post.OriginalJSON = json.dumps(value)
                if not updateLast:
                    self.LastPostName = value['data']['name']
                    updateLast = 1
                response = self.BusinessHost.ProcessInput(post)
        except requests.exceptions.HTTPError as err:
            if err.response.status_code == 429:
                self.log_warning(err.__str__())
            else:
                raise err
        except Exception as err:
            self.log_error(err.__str__())
            raise err

        return tSC
7.5. The outbound_adapter class
Outbound Adapter in Python are subclass from grongier.pex.OutboundAdapter in Python, that inherit from all the functions of the common class.
This class is responsible for sending the data to the external system.
The Outbound Adapter gives the Operation the possibility to have a heartbeat notion.
To activate this option, the CallInterval parameter of the adapter must be strictly greater than 0.

Example of an outbound adapter ( situated in the src/python/demo/reddit/adapter.py file ):
class TestHeartBeat(OutboundAdapter):

    def on_keepalive(self):
        self.log_info('beep')

    def on_task(self):
        self.log_info('on_task')
7.6. The business_service class
This class is responsible for receiving the data from external system and sending it to business processes or business operations in the production.
The business service can use an adapter to access the external system, which is specified overriding the get_adapter_type method.
There are three ways of implementing a business service:
Polling business service with an adapter - The production framework at regular intervals calls the adapter’s OnTask() method,
which sends the incoming data to the the business service ProcessInput() method, which, in turn calls the OnProcessInput method with your code.
Polling business service that uses the default adapter - In this case, the framework calls the default adapter's OnTask method with no data.
The OnProcessInput() method then performs the role of the adapter and is responsible for accessing the external system and receiving the data.
Nonpolling business service - The production framework does not initiate the business service. Instead custom code in either a long-running process
or one that is started at regular intervals initiates the business service by calling the Director.CreateBusinessService() method.
Business service in Python are subclass from grongier.pex.BusinessService in Python, that inherit from all the functions of the business host.
This class defines:
on_process_input: Receives the message from the inbond adapter via the PRocessInput method and is responsible for forwarding it to target business processes or operations.
If the business service does not specify an adapter, then the default adapter calls this method with no message and the business service is responsible for receiving the data from the external system and validating it.
Parameters:
- message_input: an instance of IRISObject or subclass of Message containing the data that the inbound adapter passes in.
The message can have any structure agreed upon by the inbound adapter and the business service.
Example of a business service ( situated in the src/python/demo/reddit/bs.py file ):
from grongier.pex import BusinessService

import iris

from message import PostMessage
from obj import PostClass

class RedditServiceWithPexAdapter(BusinessService):
    """
    This service use our python Python.RedditInboundAdapter to receive post
    from reddit and call the FilterPostRoutingRule process.
    """
    def get_adapter_type():
        """
        Name of the registred Adapter
        """
        return "Python.RedditInboundAdapter"

    def on_process_input(self, message_input):
        msg = iris.cls("dc.Demo.PostMessage")._New()
        msg.Post = message_input
        return self.send_request_sync(self.target,msg)

    def on_init(self):

        if not hasattr(self,'target'):
            self.target = "Python.FilterPostRoutingRule"

        return
7.7. The business_process class
Typically contains most of the logic in a production.
A business process can receive messages from a business service, another business process, or a business operation.
It can modify the message, convert it to a different format, or route it based on the message contents.
The business process can route a message to a business operation or another business process.
Business processes in Python are subclass from grongier.pex.BusinessProcess in Python, that inherit from all the functions of the business host.
This class defines:
on_request: Handles requests sent to the business process. A production calls this method whenever an initial request for a specific business process arrives on the appropriate queue and is assigned a job in which to execute.
Parameters:
- request: An instance of IRISObject or subclass of Message that contains the request message sent to the business process.
Returns:
An instance of IRISObject or subclass of Message that contains the response message that this business process can return
to the production component that sent the initial message.
on_response: Handles responses sent to the business process in response to messages that it sent to the target.
A production calls this method whenever a response for a specific business process arrives on the appropriate queue and is assigned a job in which to execute.
Typically this is a response to an asynchronous request made by the business process where the responseRequired parameter has a true value.
Parameters:
- request: An instance of IRISObject or subclass of Message that contains the initial request message sent to the business process.
- response: An instance of IRISObject or subclass of Message that contains the response message that this business process can return to the production component that sent the initial message.
- callRequest: An instance of IRISObject or subclass of Message that contains the request that the business process sent to its target.
- callResponse: An instance of IRISObject or subclass of Message that contains the incoming response.
- completionKey: A string that contains the completionKey specified in the completionKey parameter of the outgoing SendAsync() method.
Returns:
An instance of IRISObject or subclass of Message that contains the response message that this business process can return
to the production component that sent the initial message.
on_complete: Called after the business process has received and handled all responses to requests it has sent to targets.
Parameters:
- request: An instance of IRISObject or subclass of Message that contains the initial request message sent to the business process.
- response: An instance of IRISObject or subclass of Message that contains the response message that this business process can return to the production component that sent the initial message.
Returns:
An instance of IRISObject or subclass of Message that contains the response message that this business process can return to the production component that sent the initial message.
Example of a business process ( situated in the src/python/demo/reddit/bp.py file ):
from grongier.pex import BusinessProcess

from message import PostMessage
from obj import PostClass

class FilterPostRoutingRule(BusinessProcess):
    """
    This process receive a PostMessage containing a reddit post.
    It then understand if the post is about a dog or a cat or nothing and
    fill the right infomation inside the PostMessage before sending it to
    the FileOperation operation.
    """
    def on_init(self):

        if not hasattr(self,'target'):
            self.target = "Python.FileOperation"

        return

    def on_request(self, request):

        if 'dog'.upper() in request.post.selftext.upper():
            request.to_email_address = 'dog@company.com'
            request.found = 'Dog'
        if 'cat'.upper() in request.post.selftext.upper():
            request.to_email_address = 'cat@company.com'
            request.found = 'Cat'

        if request.found is not None:
            return self.send_request_sync(self.target,request)
        else:
            return
7.8. The business_operation class
This class is responsible for sending the data to an external system or a local system such as an iris database.
The business operation can optionally use an adapter to handle the outgoing message which is specified overriding the get_adapter_type method.
If the business operation has an adapter, it uses the adapter to send the message to the external system.
The adapter can either be a PEX adapter, an ObjectScript adapter or a python adapter.
Business operation in Python are subclass from grongier.pex.BusinessOperation in Python, that inherit from all the functions of the business host.
7.8.1. The dispacth system
In a business operation it is possbile to create any number of function similar to the on_message method that will take as argument a typed request like this my_special_message_method(self,request: MySpecialMessage).
The dispatch system will automatically analyze any request arriving to the operation and dispacth the requests depending of their type. If the type of the request is not recognized or is not specified in any on_message like function, the dispatch system will send it to the on_message function.
7.8.2. The methods
This class defines:
on_message: Called when the business operation receives a message from another production component that can not be dispatched to another function.
Typically, the operation will either send the message to the external system or forward it to a business process or another business operation.
If the operation has an adapter, it uses the Adapter.invoke() method to call the method on the adapter that sends the message to the external system.
If the operation is forwarding the message to another production component, it uses the SendRequestAsync() or the SendRequestSync() method.
Parameters:
- request: An instance of either a subclass of Message or of IRISObject containing the incoming message for the business operation.
Returns:
The response object
Example of a business operation ( situated in the src/python/demo/reddit/bo.py file ):
from grongier.pex import BusinessOperation

from message import MyRequest,MyMessage

import iris

import os
import datetime
import smtplib
from email.mime.text import MIMEText

class EmailOperation(BusinessOperation):
    """
    This operation receive a PostMessage and send an email with all the
    important information to the concerned company ( dog or cat company )
    """

    def my_message(self,request:MyMessage):
        sender = 'admin@example.com'
        receivers = 'toto@example.com'
        port = 1025
        msg = MIMEText(request.toto)

        msg['Subject'] = 'MyMessage'
        msg['From'] = sender
        msg['To'] = receivers

        with smtplib.SMTP('localhost', port) as server:
            server.sendmail(sender, receivers, msg.as_string())
            print("Successfully sent email")

    def on_message(self, request):

        sender = 'admin@example.com'
        receivers = [ request.to_email_address ]


        port = 1025
        msg = MIMEText('This is test mail')

        msg['Subject'] = request.found+" found"
        msg['From'] = 'admin@example.com'
        msg['To'] = request.to_email_address

        with smtplib.SMTP('localhost', port) as server:

            # server.login('username', 'password')
            server.sendmail(sender, receivers, msg.as_string())
            print("Successfully sent email")
If this operation is called using a MyRequest message, the my_message function will be called thanks to the dispatcher, otherwise the on_message function will be called.
7.9. The director class
The Director class is used for nonpolling business services, that is, business services which are not automatically called by the production framework (through the inbound adapter) at the call interval.
Instead these business services are created by a custom application by calling the Director.create_business_service() method.
This class defines:
create_business_service: The create_business_service() method initiates the specified business service.
Parameters:
- connection: an IRISConnection object that specifies the connection to an IRIS instance for Java.
- target: a string that specifies the name of the business service in the production definition.
Returns:
an object that contains an instance of IRISBusinessService
start_production: The start_production() method starts the production.
Parameters:
- production_name: a string that specifies the name of the production to start.
stop_production: The stop_production() method stops the production.
Parameters:
- production_name: a string that specifies the name of the production to stop.
restart_production: The restart_production() method restarts the production.
Parameters:
- production_name: a string that specifies the name of the production to restart.
list_productions: The list_productions() method returns a dictionary of the names of the productions that are currently running.
7.10. The objects
We will use dataclass to hold information in our messages in a obj.py file.
Example of an object ( situated in the src/python/demo/reddit/obj.py file ):
from dataclasses import dataclass

@dataclass
class PostClass:
    title: str
    selftext : str
    author: str
    url: str
    created_utc: float = None
    original_json: str = None
7.11. The messages
The messages will contain one or more objects, located in the obj.py file.
Messages, requests and responses all inherit from the grongier.pex.Message class.
These messages will allow us to transfer information between any business service/process/operation.
Example of a message ( situated in the src/python/demo/reddit/message.py file ):
from grongier.pex import Message

from dataclasses import dataclass

from obj import PostClass

@dataclass
class PostMessage(Message):
    post:PostClass = None
    to_email_address:str = None
    found:str = None
WIP It is to be noted that it is needed to use types when you define an object or a message.
7.12. How to regsiter a component
You can register a component to iris in many way :
- Only one component with
register_component - All the component in a file with
register_file - All the component in a folder with
register_folder
7.12.1. register_component
Start an embedded python shell :
/usr/irissys/bin/irispython
Then use this class method to add a new py file to the component list for interoperability.
from grongier.pex import Utils
Utils.register_component(<ModuleName>,<ClassName>,<PathToPyFile>,<OverWrite>,<NameOfTheComponent>)
e.g :
from grongier.pex import Utils
Utils.register_component("MyCombinedBusinessOperation","MyCombinedBusinessOperation","/irisdev/app/src/python/demo/",1,"PEX.MyCombinedBusinessOperation")
7.12.2. register_file
Start an embedded python shell :
/usr/irissys/bin/irispython
Then use this class method to add a new py file to the component list for interoperability.
from grongier.pex import Utils
Utils.register_file(<File>,<OverWrite>,<PackageName>)
e.g :
from grongier.pex import Utils
Utils.register_file("/irisdev/app/src/python/demo/bo.py",1,"PEX")
7.12.3. register_folder
Start an embedded python shell :
/usr/irissys/bin/irispython
Then use this class method to add a new py file to the component list for interoperability.
from grongier.pex import Utils
Utils.register_folder(<Path>,<OverWrite>,<PackageName>)
e.g :
from grongier.pex import Utils
Utils.register_folder("/irisdev/app/src/python/demo/",1,"PEX")
7.12.4. migrate
Start an embedded python shell :
/usr/irissys/bin/irispython
Then use this static method to migrate the settings file to the iris framework.
from grongier.pex import Utils
Utils.migrate()
7.12.4.1. setting.py file
This file is used to store the settings of the interoperability components.
It has two sections :
CLASSES : This section is used to store the classes of the interoperability components.PRODUCTIONS : This section is used to store the productions of the interoperability components.
e.g :
import bp
from bo import *
from bs import *

CLASSES = {
    'Python.RedditService': RedditService,
    'Python.FilterPostRoutingRule': bp.FilterPostRoutingRule,
    'Python.FileOperation': FileOperation,
    'Python.FileOperationWithIrisAdapter': FileOperationWithIrisAdapter,
}

PRODUCTIONS = [
    {
        'dc.Python.Production': {
        "@Name": "dc.Demo.Production",
        "@TestingEnabled": "true",
        "@LogGeneralTraceEvents": "false",
        "Description": "",
        "ActorPoolSize": "2",
        "Item": [
            {
                "@Name": "Python.FileOperation",
                "@Category": "",
                "@ClassName": "Python.FileOperation",
                "@PoolSize": "1",
                "@Enabled": "true",
                "@Foreground": "false",
                "@Comment": "",
                "@LogTraceEvents": "true",
                "@Schedule": "",
                "Setting": {
                    "@Target": "Host",
                    "@Name": "%settings",
                    "#text": "path=/tmp"
                }
            },
            {
                "@Name": "Python.RedditService",
                "@Category": "",
                "@ClassName": "Python.RedditService",
                "@PoolSize": "1",
                "@Enabled": "true",
                "@Foreground": "false",
                "@Comment": "",
                "@LogTraceEvents": "false",
                "@Schedule": "",
                "Setting": [
                    {
                        "@Target": "Host",
                        "@Name": "%settings",
                        "#text": "limit=10\nother<10"
                    }
                ]
            },
            {
                "@Name": "Python.FilterPostRoutingRule",
                "@Category": "",
                "@ClassName": "Python.FilterPostRoutingRule",
                "@PoolSize": "1",
                "@Enabled": "true",
                "@Foreground": "false",
                "@Comment": "",
                "@LogTraceEvents": "false",
                "@Schedule": ""
            }
        ]
    }
    }
]
7.12.4.1.1. CLASSES section
This section is used to store the classes of the interoperability components.
It aims to help to register the components.
This dictionary has the following structure :
- Key : The name of the component
- Value :
- The class of the component (you have to import it before)
- The module of the component (you have to import it before)
- Another dictionary with the following structure :
module : Name of the module of the component (optional)class : Name of the class of the component (optional)path : The path of the component (mandatory)
e.g :
When Value is a class or a module:
import bo
import bp
from bs import RedditService

CLASSES = {
    'Python.RedditService': RedditService,
    'Python.FilterPostRoutingRule': bp.FilterPostRoutingRule,
    'Python.FileOperation': bo,
}
When Value is a dictionary :
CLASSES = {
    'Python.RedditService': {
        'module': 'bs',
        'class': 'RedditService',
        'path': '/irisdev/app/src/python/demo/'
    },
    'Python.Module': {
        'module': 'bp',
        'path': '/irisdev/app/src/python/demo/'
    },
    'Python.Package': {
        'path': '/irisdev/app/src/python/demo/'
    },
}
7.12.4.1.2. Productions section
This section is used to store the productions of the interoperability components.
It aims to help to register a production.
This list has the following structure :
- A list of dictionary with the following structure :
dc.Python.Production : The name of the production
@Name : The name of the production@TestingEnabled : The testing enabled of the production@LogGeneralTraceEvents : The log general trace events of the productionDescription : The description of the productionActorPoolSize : The actor pool size of the productionItem : The list of the items of the production
@Name : The name of the item@Category : The category of the item@ClassName : The class name of the item@PoolSize : The pool size of the item@Enabled : The enabled of the item@Foreground : The foreground of the item@Comment : The comment of the item@LogTraceEvents : The log trace events of the item@Schedule : The schedule of the itemSetting : The list of the settings of the item
@Target : The target of the setting@Name : The name of the setting#text : The value of the setting
The minimum structure of a production is :
PRODUCTIONS = [
        {
            'UnitTest.Production': {
                "Item": [
                    {
                        "@Name": "Python.FileOperation",
                        "@ClassName": "Python.FileOperation",
                    },
                    {
                        "@Name": "Python.EmailOperation",
                        "@ClassName": "UnitTest.Package.EmailOperation"
                    }
                ]
            }
        }
    ]
You can also set in @ClassName an item from the CLASSES section.
e.g :
from bo import FileOperation
PRODUCTIONS = [
        {
            'UnitTest.Production': {
                "Item": [
                    {
                        "@Name": "Python.FileOperation",
                        "@ClassName": FileOperation,
                    }
                ]
            }
        }
    ]
As the production is a dictionary, you can add in value of the production dictionary an environment variable.
e.g :
import os

PRODUCTIONS = [
        {
            'UnitTest.Production': {
                "Item": [
                    {
                        "@Name": "Python.FileOperation",
                        "@ClassName": "Python.FileOperation",
                        "Setting": {
                            "@Target": "Host",
                            "@Name": "%settings",
                            "#text": os.environ['SETTINGS']
                        }
                    }
                ]
            }
        }
    ]
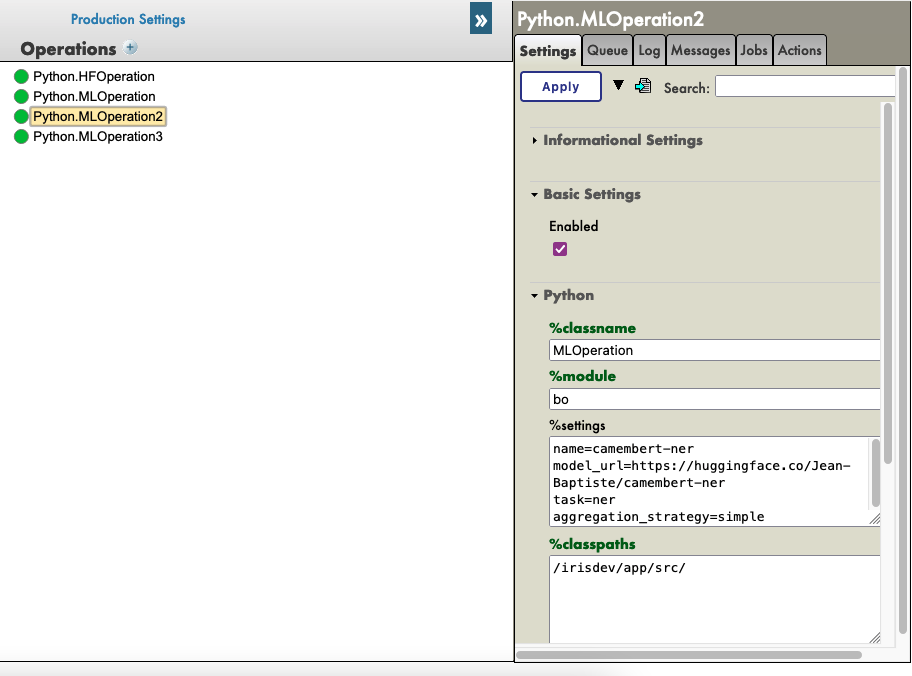
7.13. Direct use of Grongier.PEX
If you don't want to use the register_component util. You can add a Grongier.PEX.BusinessService component directly into the management portal and configure the properties :
- %module :
- Module name of your python code
- %classname :
- Classname of you component
- %classpaths
- Path where you component is.
- This can one or more Classpaths (separated by '|' character) needed in addition to PYTHON_PATH
e.g :

8. Command line
Since version 2.3.1, you can use the command line to register your components and productions.
To use it, you have to use the following command :
iop
output :
usage: python3 -m grongier.pex [-h] [-d DEFAULT] [-l] [-s START] [-k] [-S] [-r] [-M MIGRATE] [-e EXPORT] [-x] [-v] [-L]
optional arguments:
  -h, --help            display help and default production name
  -d DEFAULT, --default DEFAULT
                        set the default production
  -l, --lists           list productions
  -s START, --start START
                        start a production
  -k, --kill            kill a production (force stop)
  -S, --stop            stop a production
  -r, --restart         restart a production
  -M MIGRATE, --migrate MIGRATE
                        migrate production and classes with settings file
  -e EXPORT, --export EXPORT
                        export a production
  -x, --status          status a production
  -v, --version         display version
  -L, --log             display log

default production: PEX.Production
8.1. help
The help command display the help and the default production name.
iop -h
output :
usage: python3 -m grongier.pex [-h] [-d DEFAULT] [-l] [-s START] [-k] [-S] [-r] [-M MIGRATE] [-e EXPORT] [-x] [-v] [-L]
...
default production: PEX.Production
8.2. default
The default command set the default production.
With no argument, it display the default production.
iop -d
output :
default production: PEX.Production
With an argument, it set the default production.
iop -d PEX.Production
8.3. lists
The lists command list productions.
iop -l
output :
{
    "PEX.Production": {
        "Status": "Stopped",
        "LastStartTime": "2023-05-31 11:13:51.000",
        "LastStopTime": "2023-05-31 11:13:54.153",
        "AutoStart": 0
    }
}
8.4. start
The start command start a production.
To exit the command, you have to press CTRL+C.
iop -s PEX.Production
output :
2021-08-30 15:13:51.000 [PEX.Production] INFO: Starting production
2021-08-30 15:13:51.000 [PEX.Production] INFO: Starting item Python.FileOperation
2021-08-30 15:13:51.000 [PEX.Production] INFO: Starting item Python.EmailOperation
...
8.5. kill
The kill command kill a production (force stop).
Kill command is the same as stop command but with a force stop.
Kill command doesn't take an argument because only one production can be running.
iop -k
8.6. stop
The stop command stop a production.
Stop command doesn't take an argument because only one production can be running.
iop -S
8.7. restart
The restart command restart a production.
Restart command doesn't take an argument because only one production can be running.
iop -r
8.8. migrate
The migrate command migrate a production and classes with settings file.
Migrate command must take the absolute path of the settings file.
Settings file must be in the same folder as the python code.
iop -M /tmp/settings.py
8.9. export
The export command export a production.
If no argument is given, the export command export the default production.
iop -e
If an argument is given, the export command export the production given in argument.
iop -e PEX.Production
output :
{
    "Production": {
        "@Name": "PEX.Production",
        "@TestingEnabled": "true",
        "@LogGeneralTraceEvents": "false",
        "Description": "",
        "ActorPoolSize": "2",
        "Item": [
            {
                "@Name": "Python.FileOperation",
                "@Category": "",
                "@ClassName": "Python.FileOperation",
                "@PoolSize": "1",
                "@Enabled": "true",
                "@Foreground": "false",
                "@Comment": "",
                "@LogTraceEvents": "true",
                "@Schedule": "",
                "Setting": [
                    {
                        "@Target": "Adapter",
                        "@Name": "Charset",
                        "#text": "utf-8"
                    },
                    {
                        "@Target": "Adapter",
                        "@Name": "FilePath",
                        "#text": "/irisdev/app/output/"
                    },
                    {
                        "@Target": "Host",
                        "@Name": "%settings",
                        "#text": "path=/irisdev/app/output/"
                    }
                ]
            }
        ]
    }
}
8.10. status
The status command status a production.
Status command doesn't take an argument because only one production can be running.
iop -x
output :
{
    "Production": "PEX.Production",
    "Status": "stopped"
}
Status can be :
- stopped
- running
- suspended
- troubled
8.11. version
The version command display the version.
iop -v
output :
2.3.0
8.12. log
The log command display the log.
To exit the command, you have to press CTRL+C.
iop -L
output :
2021-08-30 15:13:51.000 [PEX.Production] INFO: Starting production
2021-08-30 15:13:51.000 [PEX.Production] INFO: Starting item Python.FileOperation
2021-08-30 15:13:51.000 [PEX.Production] INFO: Starting item Python.EmailOperation
...
9. Credits
Most of the code came from PEX for Python by Mo Cheng and Summer Gerry.
Works only on IRIS 2021.2 +

.png)