#Performance

0 Followers · 175 Posts

Performance tag groups posts regarding software performance issues and the best practices on solving and monitoring performance issues.

InterSystems staff + admins Hide everywhere
Hidden post for admin
Article Timothy Scott · Feb 28, 2025 7m read

High-Performance Message Searching in Health Connect

The Problem

Have you ever tried to do a search in Message Viewer on a busy interface and had the query time out? This can become quite a problem as the amount of data increases. For context, the instance of Health Connect I am working with does roughly 155 million Message Headers per day with 21 day message retention. To try and help with search performance, we extended the built-in SearchTable with commonly used fields in hopes that indexing these fields would result in faster query times. Despite this, we still couldn't get some of these queries to finish at all.

More Info Defining a Search Table Class.

image

For those of us working as HL7 integrators, we know that troubleshooting and responding to issues on a day-to-day basis is a huge part of our role. Quickly identifying and resolving these issues is critical to ensuring that we are maintaining the steady and accurate flow of data. Due to the poor search performance, we would have to gather very detailed information about each specific issue to find examples in Health Connect. Without a very narrow time frame (within a few minutes), we often were unable to get Message Viewer search to return any results before timing out. This caused a significant delay both in determining what the actual problem was and resolving it moving forward.

The Solution

This was not acceptable, so we had to find a solution in order to best serve our customers. Enter WRC.

image

We created a ticket, and I am happy to report a fix was identified. This fix involved going through our custom SearchTable fields and identifying which fields were not unique enough to warrant being treated as an index by the Message Viewer search.

For example, in our environment, MSH.4 (or FacilityID) is used to denote which physical hospital location the HL7 message is associated with. While this field is important to have on the SearchTable for ease of filtering, many messages come through each day for each facility. This means that it is inefficient to use this field as an index in the Message Viewer search. Counter to this would be a field like PID.18 (or Patient Account Number). The number of messages associated with each account number is very small, so using this field as an index greatly increases the speed of the search.

Adding the Unselective parameter to the appropriate items tells message search which ones to treat as indexes. This in essence modifies the SQL used to pull the messages. Below you will find the difference in queries, based on fields being used as index or not, and how you can use these queries to determine which fields should be Unselective.

Index vs NoIndex Queries

Unselective="false" (Indexed) SQL Query Plan

image

This query is looping over the SearchTable values and, for each row, cross-referencing the MessageHeader table. For a value that is unique and doesn’t have many messages associated with it (i.e. Patient Account Number), this is more efficient.

Unselective="true" (%NOINDEX) SQL Query Plan

image

This query is looping over the MessageHeader table and, for each row, cross-referencing the SearchTable values. For a value that has many results associated with it (i.e. FacilityID), this method is faster to return the results.

How to Identify Problem Fields

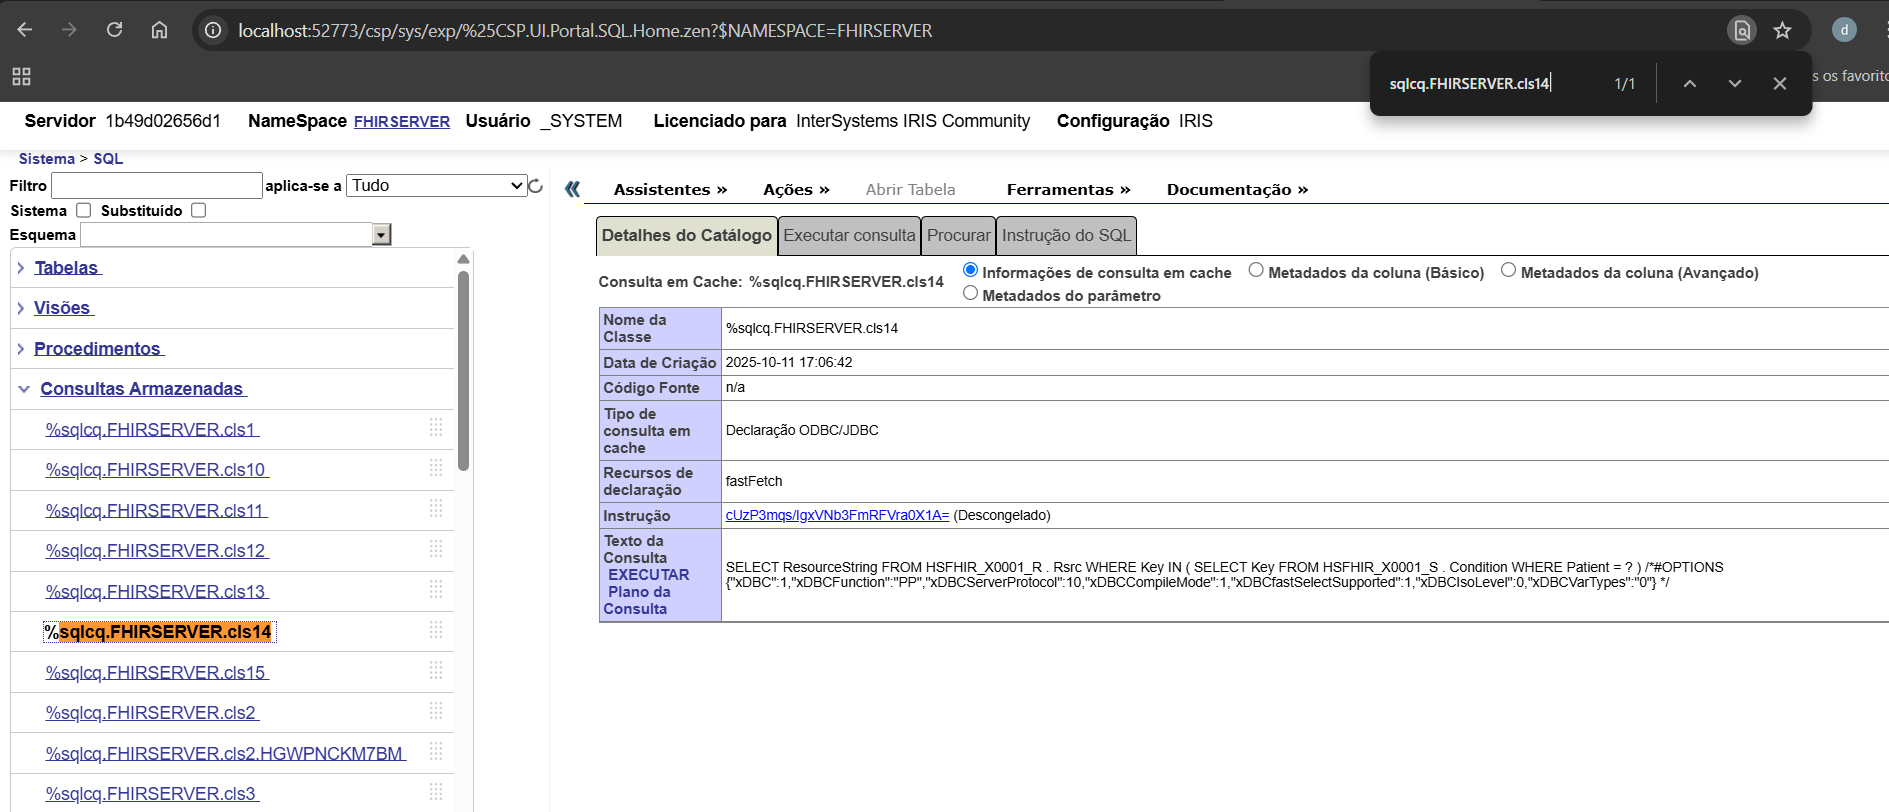
The best way I have found to identify which fields need to be marked as Unselective is with Show Query. Create a separate search using each field in Message Viewer (adding the SearchTable field via Add Criterion) then click Show Query to show you the actual SQL being used by Message Viewer to pull the messages based on the filters selected.

image

Our first example is using a field from the SearchTable that does not have the Unselected parameter added. Notice the EnsLib_HL7.SearchTable.PropId = 19 and EnsLib_HL7.SearchTable.PropValue = '2009036'. This indicates the SearchTable field added as a filter and what value is being checked. Keep in mind that the ProdId will be unique to each search table field and may change from environment to environment.

image

How to Add Show Query to Message Viewer

If you don’t have the Show Query button enabled in Message Viewer, you can set the following Global in your given namespace.

set ^Ens.Debug("UtilEnsMessages","sql")=1

Viewing the SQL Query Used by the Message Viewer

SQL - Unselective=“false”

SELECT TOP 100 
head.ID As ID, {fn RIGHT(%EXTERNAL(head.TimeCreated),999 )} As TimeCreated, 
head.SessionId As Session, head.Status As Status, 
CASE head.IsError 
WHEN 1 
THEN 'Error' ELSE 'OK' END As Error, head.SourceConfigName As Source, 
head.TargetConfigName As Target, head.SourceConfigName, head.TargetConfigName, 
head.MessageBodyClassName As BodyClassname, 
(SELECT LIST(PropValue) 
FROM EnsLib_HL7.SearchTable 
WHERE (head.MessageBodyId = DocId) And PropId=19) As SchTbl_FacilityID, 
EnsLib_HL7.SearchTable.PropId As SchTbl_PropId 
FROM Ens.MessageHeader head, EnsLib_HL7.SearchTable 
WHERE (((head.SourceConfigName = 'component_name' OR head.TargetConfigName = 'component_name')) 
AND head.MessageBodyClassName=(('EnsLib.HL7.Message')) 
AND (head.MessageBodyId = EnsLib_HL7.SearchTable.DocId) 
AND EnsLib_HL7.SearchTable.PropId = 19 AND EnsLib_HL7.SearchTable.PropValue = '2009036') 
ORDER BY head.ID Desc

Next, take that query into SQL and manually modify it to add %NOINDEX. This is what is telling the query to not treat this value as an index.

SQL - Unselective=”true” - %NOINDEX

SELECT TOP 100 
head.ID As ID, {fn RIGHT(%EXTERNAL(head.TimeCreated),999 )} As TimeCreated, 
head.SessionId As Session, head.Status As Status, 
CASE head.IsError 
WHEN 1 
THEN 'Error' ELSE 'OK' END As Error, head.SourceConfigName As Source, 
head.TargetConfigName As Target, head.SourceConfigName, head.TargetConfigName, 
head.MessageBodyClassName As BodyClassname, 
(SELECT LIST(PropValue) 
FROM EnsLib_HL7.SearchTable 
WHERE (head.MessageBodyId = DocId) And PropId=19) As SchTbl_FacilityID, 
EnsLib_HL7.SearchTable.PropId As SchTbl_PropId 
FROM Ens.MessageHeader head, EnsLib_HL7.SearchTable 
WHERE (((head.SourceConfigName = 'component_name' OR head.TargetConfigName = 'component_name')) 
AND head.MessageBodyClassName='EnsLib.HL7.Message' 
AND (head.MessageBodyId = EnsLib_HL7.SearchTable.DocId) 
AND EnsLib_HL7.SearchTable.PropId = 19 AND %NOINDEX EnsLib_HL7.SearchTable.PropValue = (('2009036'))) 
ORDER BY head.ID Desc

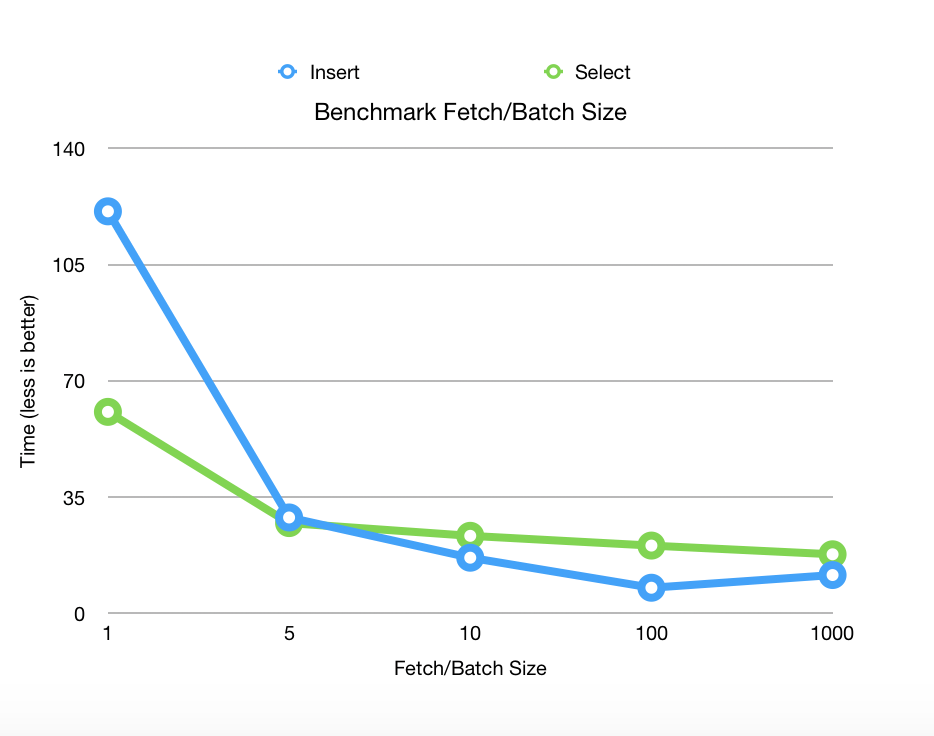
If there is a significant difference in the amount of time needed to return the first and second queries, then you have found a field that should be modified. In our case, we went from queries timing out after a few minutes to an almost instantaneous return.

Applying the Fix - Modifying Your Code

Once you have identified which fields need to be fixed, you can add the Unselective="true" to each affected Item in your custom SearchTable class. See the below example.

Custom SearchTable Class

/// Custom HL7 Search Table adds additional fields to index.
Class CustomClasses.SearchTable.CustomSearchTable Extends EnsLib.HL7.SearchTable
{

XData SearchSpec [ XMLNamespace = "http://www.intersystems.com/EnsSearchTable" ]
{
<Items>
		// Increase performance by setting Unselective="true" on fields that are not highly unique.
		// This essentially tells Message Search to not use an index on these fields.

		// facility ID in MSH.4
   		<Item DocType=""	PropName="FacilityID" Unselective="true">		[MSH:4]		</Item>
   		// Event Reason in EVN.4
   		<Item DocType=""	PropName="EventReason" Unselective="true">		[EVN:4]		</Item>
   		// Patient Account (Add PV1.19 to prebuilt PID.18 search)
   		<Item DocType=""	PropName="PatientAcct">		[PV1:19]	</Item>
   		// Document type
   		<Item DocType=""	PropName="DocumentType" Unselective="true">	[TXA:2]		</Item>
   		// Placer Order ID
   		<Item DocType=""	PropName="PlacerOrderID">	[OBR:2.1]	</Item>
   		// Filler Order ID
   		<Item DocType=""	PropName="FillerOrderID">	[OBR:3.1]	</Item>
   		// Universal Service ID
   		<Item DocType=""	PropName="ServiceID" Unselective="true">		[OBR:4.1]	</Item>
   		// Universal Service ID
   		<Item DocType=""	PropName="ProcedureName" Unselective="true">	[OBR:4.2]	</Item>		
   		// Diagnostic Service Section
   		<Item DocType=""	PropName="ServiceSectID" Unselective="true">	[OBR:24]	</Item>
   		// Appointment ID
   		<Item DocType=""	PropName="AppointmentID">	[SCH:2]		</Item>
   		// Provider Fields
   		<Item DocType=""	PropName="ProviderNameMFN">	[STF:3()]		</Item>
   		<Item DocType=""	PropName="ProviderIDsMFN">	[MFE:4().1]		</Item>
   		<Item DocType=""	PropName="ProviderIDsMFN">	[STF:1().1]		</Item>
   		<Item DocType=""	PropName="ProviderIDsMFN">	[PRA:6().1]		</Item>
	</Items>
}

Storage Default
{
<Type>%Storage.Persistent</Type>
}

}

Summary

Quick message searching is vital to day-to-day integration operations. By utilizing the Unselective property, it is now possible to maintain this functionality, despite an ever-growing database. With this quick and easy-to-implement change, you will be back on track to confidently providing service and troubleshooting issues in your Health Connect environment.

1
8 219
Article Jinyao · Feb 21, 2025 4m read

Motivation

I didn't know about ObjectScript until I started my new job. Objectscript isn't actually a young programming language. Compared to C++, Java and Python, the community isn't as active, but we're keen to make this place more vibrant, aren't we?

I've noticed that some of my colleagues are finding it tricky to get their heads around the class relationships in these huge projects. There aren't any easy-to-use modern class diagram tool for ObjectScript.

Related Work

I have tried relavant works:

10
4 473
Article Harshitha · Oct 22, 2025 2m read

Hello community,

I wanted to share my experience about working on Large Data projects. Over the years, I have had the opportunity to handle massive patient data, payor data and transactional logs while working in an hospital industry. I have had the chance to build huge reports which had to be written using advanced logics fetching data across multiple tables whose indexing was not helping me write efficient code.

Here is what I have learned about managing large data efficiently.

Choosing the right data access method.

As we all here in the community are aware of, IRIS provides multiple ways to access data. Choosing the right method, depends on the requirement.

  • Direct Global Access: Fastest for bulk read/write operations. For example, if i have to traverse through indexes and fetch patient data, I can loop through the globals to process millions of records. This will save a lot of time.
Set ToDate=+HSet FromDate=+$H-1ForSet FromDate=$O(^PatientD("Date",FromDate)) Quit:FromDate>ToDate  Do
. Set PatId=""ForSet PatId=$Order(^PatientD("Date",FromDate,PatID)) Quit:PatId=""Do
. . Write$Get(^PatientD("Date",FromDate,PatID)),!
  • Using SQL: Useful for reporting or analytical requirements, though slower for huge data sets.
6
1 102
Article Vachan C Rannore · Oct 21, 2025 3m read

Hello!!!

Data migration often sounds like a simple "move data from A to B task" until you actually do it. In reality, it is a complex process that blends planning, validation, testing, and technical precision.

Over several projects where I handled data migration into a HIS which runs on IRIS (TrakCare), I realized that success comes from a mix of discipline and automation.

Here are a few points which I want to highlight.

1. Start with a Defined Data Format.

Before you even open your first file, make sure everyone, especially data providers, clearly understands the exact data format you expect. Defining templates early avoids unnecessary bank-and-forth and rework later. 

While Excel or CSV formats are common, I personally feel using a tab-delimited text file (.txt) for data upload is best. It's lightweight, consistent, and avoids issues with commas inside text fields. 

PatID   DOB Gender  AdmDate
10001   2000-01-02  M   2025-10-01
10002   1998-01-05  F   2025-10-05
10005   1980-08-23  M   2025-10-15

Make sure that the date formats given in the file is correct and constant throughout the file because all these files are usually converted from an Excel file and an Basic excel user might make mistakes while giving you the date formats wrong. Wrong date formats can irritate you while converting into horolog.

8
1 103
Article Davi Massaru Teixeira Muta · Oct 11, 2025 9m read

Technical Documentation — Quarkus IRIS Monitor System

1. Purpose and Scope

This module enables integration between Quarkus-based Java applications and InterSystems IRIS’s native performance monitoring capabilities.
It allows a developer to annotate methods with @PerfmonReport, which triggers IRIS’s ^PERFMON routines automatically around method execution, generating performance reports without manual intervention.


2. System Components

2.1 Annotation: @PerfmonReport

  • Defined as a CDI InterceptorBinding.
  • Can be applied to methods or classes.
  • Directs the framework to wrap method execution with IRIS monitoring logic.

2.2 Interceptor: PerfmonReportInterceptor

  • Intercepts calls to annotated methods.

  • Execution flow:

    1. Log start event (LOG.infof("INIT: …"))
    2. Call monitorSystem.startPerfmon()
    3. Proceed with context.proceed()
    4. In a finally block:
      • Call monitorSystem.generateReportPerfmon(...)
      • Call monitorSystem.stopPerfmon()
      • Log end event with execution time
  • Ensures that monitoring is always ended, even if an exception is thrown.

2.3 DAO Bean: MonitorSystem

  • CDI bean annotated with @ApplicationScoped.

  • Holds a single instance of IRIS initialized at startup.

  • Configuration injected via @ConfigProperty (JDBC URL, user, password).

  • Uses DriverManager.getConnection(...) to obtain a raw IRISConnection.

  • Contains methods:

    • startPerfmon()
    • generateReportPerfmon(String reportName)
    • stopPerfmon()
  • Each calls the appropriate ObjectScript methods in iris.src.dc.AdapterPerfmonProc via iris.classMethodVoid(...).

2.4 ObjectScript Adapter: iris.src.dc.AdapterPerfmonProc

  • Defines the routines that encapsulate ^PERFMON logic:

      Class iris.src.dc.AdapterPerfmonProc Extends %RegisteredObject
      {
          ClassMethod start() As %Status
          {
              Set namespace = $NAMESPACE
              zn "%SYS"
              set status = $$Stop^PERFMON()
              set status = $$Start^PERFMON()
              zn namespace
              return status
          }
    
          ClassMethod generateReport(nameReport As %String = "report.txt") As %Status
          {
              Set namespace = $NAMESPACE
              zn "%SYS"
              Set tempDirectory = ##class(%SYS.System).TempDirectory()
              set status = $$Report^PERFMON("R","R","P", tempDirectory_"/"_nameReport)
              zn namespace
    
              return status
          }
    
          ClassMethod stop() As %Status
          {
              Set namespace = $NAMESPACE
              zn "%SYS"
              Set status = $$Stop^PERFMON()
              zn namespace
    
              return status
          }
      }
    
  • Operates in namespace %SYS to access ^PERFMON routines, then returns to the original namespace.


3. Execution Flow

  1. A request enters the Quarkus application.

  2. The CDI interceptor detects the @PerfmonReport annotation and intercepts the method call.

  3. monitorSystem.startPerfmon() is invoked, triggering IRIS ^PERFMON monitoring.

  4. The business method executes normally (data access, transformations, logic, etc.).

  5. After the method returns or throws an exception, the interceptor ensures:

    • monitorSystem.generateReportPerfmon(...) is called to create a .txt performance report.
    • monitorSystem.stopPerfmon() is executed to stop the monitoring session.
    • The total Java-side execution time is logged using Logger.infof(...).
  6. The generated report file is stored in the IRIS temporary directory, typically: /usr/irissys/mgr/Temp/

    • The file name follows the pattern: <ClassName><MethodName><timestamp>.txt

4. Technical Challenges and Solutions

ChallengeSolution
ClassCastException when using pooled JDBC connectionsUse DriverManager.getConnection(...) to obtain a native IRISConnection instead of the pooled ConnectionWrapper.
Overhead from repeatedly opening connectionsMaintain a single IRIS instance within an @ApplicationScoped bean, initialized via @PostConstruct.
Ensuring ^PERFMON is always stopped even on exceptionsUse try-finally in the interceptor to call stopPerfmon() and generateReportPerfmon().
Configuration portabilityInject connection settings (jdbc.url, username, password) using @ConfigProperty and application.properties.
Managing concurrent monitor sessionsAvoid annotating highly concurrent endpoints. Future versions may implement session-level isolation.

5. Use Cases and Benefits

  • Enables real-time visibility into IRIS runtime activity from Java code.
  • Simplifies performance analysis and query optimization for developers.
  • Useful for benchmarking, profiling, and system regression testing.
  • Can serve as a lightweight performance audit trail for critical operations.

6. Practical Example of Use

The complete source code and deployment setup are available at:


6.1 Overview

The application runs a Quarkus server connected to an InterSystems IRIS instance configured with the FHIRSERVER namespace.
The ORM layer is implemented using Hibernate ORM with PanacheRepository, allowing direct mapping between Java entities and IRIS database classes.

When the application starts (via docker-compose up), it brings up:

  • The IRIS container, hosting the FHIR data model and ObjectScript routines (including AdapterPerfmonProc);
  • The Quarkus container, exposing REST endpoints and connecting to IRIS via the native JDBC driver.

6.2 REST Endpoint

A REST resource exposes a simple endpoint to retrieve patient information:

@Path("/patient")
public class PatientResource {

    @Inject
    PatientService patientService;

    @GET
    @Path("/info")
    @Produces(MediaType.APPLICATION_JSON)
    public PatientInfoDTO searchPatientInfo(@QueryParam("key") String key) {
        return patientService.patientGetInfo(key);
    }
}

This endpoint accepts a query parameter (key) that identifies the patient resource within the FHIR data repository.


### 6.3 Service Layer with @PerfmonReport

The PatientService class contains the business logic to retrieve and compose patient information. It is annotated with @PerfmonReport, which means each request to /patient/info triggers IRIS performance monitoring:

@ApplicationScoped
public class PatientService {

    @Inject
    PatientRepository patientRepository;

    @PerfmonReport
    public PatientInfoDTO patientGetInfo(String patientKey) {

        Optional<Patient> patientOpt = patientRepository.find("key", patientKey).firstResultOptional();
        Patient patient = patientOpt.orElseThrow(() -> new IllegalArgumentException("Patient not found"));

        PatientInfoDTO dto = new PatientInfoDTO();
        dto.setKey(patient.key);
        dto.setName(patient.name);
        dto.setAddress(patient.address);
        dto.setBirthDate(patient.birthDate != null ? patient.birthDate.toString() : null);
        dto.setGender(patient.gender);
        dto.setMedications(patientRepository.findMedicationTextByPatient(patientKey));
        dto.setConditions(patientRepository.findConditionsByPatient(patientKey));
        dto.setAllergies(patientRepository.findAllergyByPatient(patientKey));

        return dto;
    }
}

6.4 Execution Flow

A request is made to: GET /patient/info?key=Patient/4

Quarkus routes the request to PatientResource.searchPatientInfo().

The CDI interceptor detects the @PerfmonReport annotation in PatientService.patientGetInfo().

Before executing the service logic:

  • The interceptor invokes MonitorSystem.startPerfmon(), which calls the IRIS class iris.src.dc.AdapterPerfmonProc.start().

  • The method executes business logic, querying patient data using Hibernate PanacheRepository mappings.

After the method completes:

  • MonitorSystem.generateReportPerfmon() is called to create a performance report.

  • MonitorSystem.stopPerfmon() stops the IRIS performance monitor.

A .txt report is generated under: usr/irissys/mgr/Temp/

Example filename: PatientService_patientGetInfo_20251005_161906.txt

6.5 Result

The generated report contains detailed IRIS runtime statistics, for example:

                         Routine Activity by Routine

Started: 10/11/2025 05:07:30PM                    Collected: 10/11/2025 05:07:31PM

Routine Name                        RtnLines  % Lines   RtnLoads  RtnFetch  Line/Load Directory
----------------------------------- --------- --------- --------- --------- --------- ---------
Other                                     0.0       0.0       0.0       0.0         0
PERFMON                                  44.0       0.0       0.0       0.0         0 /usr/irissys/mgr/
%occLibrary                         3415047.0      34.1   48278.0       0.0      70.7 /usr/irissys/mgr/irislib/
iris.src.dc.AdapterPerfmonProc.1          7.0       0.0       2.0       0.0       3.5 /usr/irissys/mgr/FHIRSERVER/
%occName                            5079994.0      50.7       0.0       0.0         0 /usr/irissys/mgr/irislib/
%apiDDL2                            1078497.0      10.8   63358.0       0.0      17.0 /usr/irissys/mgr/irislib/
%SQL.FeatureGetter.1                 446710.0       4.5   66939.0       0.0       6.7 /usr/irissys/mgr/irislib/
%SYS.WorkQueueMgr                       365.0       0.0       1.0       0.0     365.0 /usr/irissys/mgr/
%CSP.Daemon.1                            16.0       0.0       1.0       0.0      16.0 /usr/irissys/mgr/irislib/
%SYS.TokenAuth.1                         14.0       0.0       5.0       0.0       2.8 /usr/irissys/mgr/
%Library.PosixTime.1                      2.0       0.0       0.0       0.0         0 /usr/irissys/mgr/irislib/
%SYS.sqlcq.uEXTg3QR7a7I7Osf9e8Bz...      52.0       0.0       1.0       0.0      52.0 /usr/irissys/mgr/
%SYS.SQLSRV                              16.0       0.0       0.0       0.0         0 /usr/irissys/mgr/
%apiOBJ                                 756.0       0.0       0.0       0.0         0 /usr/irissys/mgr/irislib/
FT.Collector.1                            0.0       0.0       0.0       0.0         0 /usr/irissys/mgr/
SYS.Monitor.FeatureTrackerSensor.1        0.0       0.0       0.0       0.0         0 /usr/irissys/mgr/
%SYS.Monitor.Control.1                    0.0       0.0       0.0       0.0         0 /usr/irissys/mgr/
%SYS.DBSRV.1                            252.0       0.0       4.0       0.0      63.0 /usr/irissys/mgr/
%sqlcq.FHIRSERVER.cls12.1                19.0       0.0       0.0       0.0         0 /usr/irissys/mgr/irislocaldata/
%sqlcq.FHIRSERVER.cls13.1                74.0       0.0       0.0       0.0         0 /usr/irissys/mgr/irislocaldata/
%sqlcq.FHIRSERVER.cls14.1                74.0       0.0       0.0       0.0         0 /usr/irissys/mgr/irislocaldata/
%sqlcq.FHIRSERVER.cls15.1                52.0       0.0       0.0       0.0         0 /usr/irissys/mgr/irislocaldata/
%SYS.System.1                             1.0       0.0       0.0       0.0         0 /usr/irissys/mgr/

This data provides precise insight into what routines were executed internally by IRIS during that REST call — including SQL compilation, execution, and FHIR data access.

Insight: The %sqlcq.FHIRSERVER.* routines capture all SQL cache queries executed by Quarkus within the method. Monitoring these routines allows developers to analyze query execution, understand code behavior, and identify potential performance bottlenecks. This makes them a powerful tool for development and debugging of FHIR-related operations.

image

6.6 Summary

This example demonstrates how a standard Quarkus service can transparently leverage IRIS native monitoring tools using the @PerfmonReport annotation. It combines:

  • CDI interceptors (Quarkus)

  • Hibernate PanacheRepositories (ORM)

  • IRIS native ObjectScript routines (^PERFMON)

The result is a fully automated and reproducible performance profiling mechanism that can be applied to any service method in the application.

1
0 44
Question Dmitrii Baranov · Oct 12, 2025

I need to build an integration solution that reads messages from a Kafka topic. The topic has 3 partitions and contains several million messages.

For certain reasons, I can only use the standard EnsLib.Kafka.Service class and cannot use either KafkaClient or Python.

To measure performance and collect statistics I created a simple key + timestamp table with no indexes (so it is unlikely to be a bottleneck). Next, I started an instance of EnsLib.Kafka.Service. In the OnProcessInput method, I receive a message, extract the key from it, get the current time, and write the row to the table.

The statistics shows that as messages are read, performance degrades literally by the minute. In the first minute, the business service is capable of processing up to 25000 messages per minute, then performance gradually decreases, and after 10 minutes performance drops to 2000 messages per minute.

Pool Size = 1, Call Interval = 5 First run 2025-10-11 19:01:00 25880 2025-10-11 19:02:00 12468 2025-10-11 19:03:00 8013 2025-10-11 19:04:00 6626 2025-10-11 19:05:00 5023 2025-10-11 19:06:00 4947 2025-10-11 19:07:00 3912 2025-10-11 19:08:00 3539 2025-10-11 19:09:00 3529 2025-10-11 19:10:00 3169 2025-10-11 19:11:00 2955 2025-10-11 19:12:00 2914 2025-10-11 19:13:00 2771 2025-10-11 19:14:00 2624 2025-10-11 19:15:00 2446 2025-10-11 19:16:00 2754 2025-10-11 19:17:00 2545 2025-10-11 19:18:00 2350 2025-10-11 19:19:00 2314 2025-10-11 19:20:00 2274 Pool Size = 1, Call Interval = 5 Second run 2025-10-11 19:22:00 22892 2025-10-11 19:23:00 15239 2025-10-11 19:24:00 11489 2025-10-11 19:25:00 8267 2025-10-11 19:26:00 6351 2025-10-11 19:27:00 5268 2025-10-11 19:28:00 4779 2025-10-11 19:29:00 4502 2025-10-11 19:30:00 3854 2025-10-11 19:31:00 4048 2025-10-11 19:32:00 3675 2025-10-11 19:33:00 3434 2025-10-11 19:34:00 2981 2025-10-11 19:35:00 3101 2025-10-11 19:36:00 2869 2025-10-11 19:37:00 2343

I tried to play with other configuration properties (CallInterval, ReceiveSettings = { "pollInterval": 1000 }) but that didn't help and even caused Java OutOfMemory error.

How can this problem be solved?

5
0 42
Article Benjamin De Boe · Jun 19, 2025 10m read

This article describes a significant enhancement of how InterSystems IRIS deals with table statistics, a crucial element for IRIS SQL processing, in the 2025.2 release. We'll start with a brief refresher on what table statistics are, how they are used, and why we needed this enhancement. Then, we'll dive into the details of the new infrastructure for collecting and saving table statistics, after which we'll zoom in onto what the change means in practice for your applications. We'll end with a few additional notes on patterns enabled by the new model, and look forward to the follow-on phases of this initial delivery.

6
4 225
Article Yuri Marx · Aug 8, 2025 11m read

This article outlines the process of utilizing the renowned Jaeger solution for tracing InterSystems IRIS applications. Jaeger is an open-source product for tracking and identifying issues, especially in distributed and microservices environments. This tracing backend that emerged at Uber in 2015 was inspired by Google's Dapper and Twitter's OpenZipkin. It later joined the Cloud Native Computing Foundation (CNCF) as an incubating project in 2017, achieving graduated status in 2019. This guide will demonstrate how to operate the containerized Jaeger solution integrated with IRIS.

2
5 173
Article Henry Pereira · Sep 29, 2024 3m read

sql-embedding cover

InterSystems IRIS 2024 recently introduced the vector types. This addition empowers developers to work with vector search, enabling efficient similarity searches, clustering, and a range of other applications. In this article, we will delve into the intricacies of vector types, explore their applications, and provide practical examples to guide your implementation.

At its essence, a vector type is a structured collection of numerical values arranged in a predefined order. These values serve to represent different attributes, features, or characteristics of an object.

SQL-Embedding: A Versatile Tool

To streamline the creation and utilization of embeddings for vector searches within SQL queries, we introduces SQL-Embedding tool. This feature enables to leverage a diverse range of embedding models directly within their SQL databases, tailored to their specific requirements.

Practical Example: Similarity Search

Let's consider a scenario where we aim to determine the similarity between two texts using the fastembed model and SQL-Embedding. The following SQL query showcases how this can be accomplished:

SELECT
 VECTOR_DOT_PRODUCT(
 embFastEmbedModel1,
 dc.embedding('my text', 'fastembed/BAAI/bge-small-en-v1.5')
 ) AS "Similarity between 'my text' and itself",
 VECTOR_DOT_PRODUCT(
 embFastEmbedModel1,
 dc.embedding('lorem ipsum', 'fastembed/BAAI/bge-small-en-v1.5')
 ) AS "Similarity between 'my text' and 'lorem ipsum'"
FROM testvector;

Caching

One of the significant benefits of using SQL-Embedding in InterSystems IRIS is its ability to cache repeated embedding requests. This caching mechanism significantly improves performance by reducing the computational overhead associated with generating embeddings for identical or similar inputs.

How Caching Works

When you execute a SQL-Embedding query, InterSystems IRIS checks if the embedding for the given input has already been cached. If it exists, the cached embedding is retrieved and used directly, eliminating the need to regenerate it. This is particularly advantageous in scenarios where the same embeddings are frequently requested, such as in recommendation systems or search applications.

Caching Benefits

  • Reduced Latency: By avoiding redundant embedding calculations, caching can significantly reduce query response times.
  • Improved Scalability: Caching can handle increased workloads more efficiently, as it reduces the strain on the underlying embedding models.
  • Optimized Resource Utilization: Caching helps conserve computational resources by avoiding unnecessary calculations.

In conclusion, the introduction of vector types in InterSystems IRIS presents a robust tool for working with numerical object representations. By harnessing similarity searches, SQL-Embedding, and various applications, developers can unlock new possibilities and enhance their data-driven solutions.

If you found our app interesting and contributed some insight, please vote for sql-embeddings and help us on this journey!

2
2 279
Question Ward De Backer · Oct 26, 2022

Hi,

If I test the Native api for Node.js from the documentation, I noticed (if I'm correct) all methods and calls are synchronous. By default due to the nature of Node.js, there is only one thread of execution and normally  all JavaScript methods and all calls should be asynchronous and use either a callback function (the "old way") or promises or the async/await contruct to return their result, e.g.:

  • myFunction(params, callbackFunction(response))
  • myFunction(params).then(resolveFunction(response))
  • async someFunction() {
    ​​​​​  response = await myFunction(params)
    }
15
0 806
Question Norman W. Freeman · Jul 7, 2025

In IRIS, every time a request need to be processed, a specific IRIS process (IRISDB.EXE) need to be assigned to handle that request.

If there is no spare IRIS process at that time, process will need to be created (and later destroyed). On some Windows systems (especially with security/antimalware solutions being active) creating new processes can be slow, which can results in delays during peak times (due to inrush of requests).

2
0 73
Question Alexey Maslov · Jun 10, 2025

Having been inspired with Shared code execution speed question/discussion, I dare to ask another one which is annoying me and my colleagues for several weeks.

We have a routine called Lib that comprises 200 $$-functions of 1500 code lines total. It was noticed that after calling _any_ function of another rather big routine (1900 functions, 32000 lines) the next call of $$someFunction^Lib(x) is getting 10-20% slower than previous call of the same function. This effect doesn't depend on: 

16
0 257
Discussion Harshitha · May 30, 2025

Hey everyone,

I'm diving deeper into Caché ObjectScript and would love to open a discussion around the most useful tips, tricks, and best practices you’ve learned or discovered while working with it.

Whether you're an experienced developer or just getting started, ObjectScript has its own set of quirks and powerful features—some well-documented, others hidden gems. I’m looking to compile a helpful set of ideas from the community.

Some areas I’m especially interested in:

3
4 145
Question Norman W. Freeman · May 20, 2025

Hello,
I have created this script that does lot of writes to a single global. DB write performance is much slower than expected (compared to another similar systems).

set rec = "..."//fill it with somethingset time = $piece($horolog,",",2)
while(($piece($horolog,",",2)-time) < 30) //30 secondsset^A($System.Util.CreateGUID()) = rec
}

I have notified the following : 

9
1 186
Article Guillaume Rongier · Apr 9, 2019 3m read

IRIS and Ensemble are designed to act as an ESB/EAI. This mean they are build to process lots of small messages.

But some times, in real life we have to use them as ETL. The down side is not that they can't do so, but it can take a long time to process millions of row at once.

To improve performance, I have created a new SQLOutboundAdaptor who only works with JDBC.

BatchSqlOutboundAdapter

Extend EnsLib.SQL.OutboundAdapter to add batch batch and fetch support on JDBC connection.

Benchmark

Benchmarks released on Postgres 11.2 with 1 000 000 rows fetched and 100 000 rows inserted on 2 columns.

alt text

Prerequisites

Can be used on IRIS or Ensemble 2017.2+.

Installing

Clone this repository

git clone https://github.com/grongierisc/BatchSqlOutboundAdapter.git

Use Grongier.SQL.SqlOutboundAdapter adaptor.

New methods from the adaptor

  • Method ExecuteQueryBatchParmArray(ByRef pRS As Grongier.SQL.GatewayResultSet, pQueryStatement As %String, pBatchSize As %Integer, ByRef pParms) As %Status
    • pRS is the ResultSet can be use as any EnsLib.SQL.GatewayResultSet
    • pQueryStatement is the SQL query you like to execute
    • pBatchSize is the fetch size JDBC parameter
  • Method ExecuteUpdateBatchParamArray(Output pNumRowsAffected As %Integer, pUpdateStatement As %String, pParms...) As %Status
    • pNumRowsAffected is the number of row inserted
    • pUpdateStatement is teh update/insert SQL statement
    • pParms is Caché Multidimensional Array
      • pParms indicate the number of row in batch
      • pParms(integer) indicate the number of parameters in the row
      • pParms(integer,integerParam) indicate the value of the parameter whose position is integerParam.
      • pParms(integer,integerParam,"SqlType") indicate the SqlType of the parameter whose position is integerParam, by default it will be $$$SqlVarchar

Example

  • Grongier.Example.SqlSelectOperation show an example of ExecuteQueryBatchParmArray
  • Grongier.Example.SqlSelectOperation show an example of ExecuteUpdateBatchParamArray

Content of this project

This adaptor include :

  • Grongier.SQL.Common
    • No modification, simple extend of EnsLib.SQL.Common
  • Grongier.SQL.CommonJ
    • No modification, simple extend of EnsLib.SQL.CommonJ
  • Grongier.SQL.GatewayResultSet
    • Extension of EnsLib.SQL.GatewayResultSet to gain the ablility to use fetch size.
  • Grongier.SQL.JDBCGateway
    • Use to allow compilation and support on Ensemble 2017.1 and lower
  • Grongier.SQL.OutboundAdapter
    • The new adaptor with :
      • ExecuteQueryBatchParmArray allow SQL query a distant database and specify the JDBC fetchSize
      • ExecuteUpdateBatchParamArray allow insertion in a distant database with JDBC addBatch and executeBatch
  • Grongier.SQL.Snapshot
    • Extend of EnsLib.SQL.Snapshot to handle Grongier.SQL.GatewayResultSet and the fetch size property
10
3 1851
Article Lorenzo Scalese · May 22, 2025 9m read

Introduction

MonLBL is a tool for analyzing the performance of ObjectScript code execution line by line. codemonitor.MonLBL is a wrapper based on the %Monitor.System.LineByLine package from InterSystems IRIS, designed to collect precise metrics on the execution of routines, classes, or CSP pages.

The wrapper and all examples presented in this article are available in the following GitHub repository: iris-monlbl-example

Features

The utility allows the collection of several types of metrics:

  • RtnLine: Number of executions of the line
  • GloRef: Number of global references generated by the line
  • Time: Execution time of the line
  • TotalTime: Total execution time, including called subroutines

All metrics are exported to CSV files.

In addition to line-by-line metrics, dc.codemonitor.MonLBL collects global statistics:

  • Total execution time
  • Total number of executed lines
  • Total number of global references
  • System and user CPU time:
    • User CPU time corresponds to the time spent by the processor executing application code
    • System CPU time corresponds to the time spent by the processor executing operating system operations (system calls, memory management, I/O)
  • Disk read time

Prerequisites

To monitor code with MonLBL:

  1. Obtain the dc.codemonitor.MonLBL class (available here)
  2. The routines or classes to analyze must be compiled with the "ck" flags

⚠️ Important Warning

Using line-by-line monitoring impacts the server performance. It is important to follow these recommendations:

  • Use this tool only on a limited set of code and processes (ideally for one-off execution in a terminal)
  • Avoid using it on a production server (but sometime we need it)
  • Prefer using this tool in a development or test environment

These precautions are essential to avoid performance issues that could affect users or production systems. Note that monitored code runs approximately 15-20% slower than unmonitored code.

Usage

Basic Example

// Create an instance of MonLBL
Set mon = ##class(dc.codemonitor.MonLBL).%New()

// Define the routines to monitor
Set mon.routines = $ListBuild("User.MyClass.1")

// Start monitoring
Do mon.startMonitoring()

// Code to analyze...
// ...

// Stop monitoring and generate results
Do mon.stopMonitoring()

Note: Monitoring started here is only valid for the current process. Other processes executing the same code will not be included in the measurements.

Configuration Options

The wrapper offers several configurable options:

  • directory: Directory where CSV files will be exported (default is the IRIS Temp directory)
  • autoCompile: Automatically recompiles routines with the "ck" flags if necessary
  • metrics: Customizable list of metrics to collect
  • decimalPointIsComma: Uses a comma as the decimal separator for better compatibility with Excel (depending your local environment)
  • metricsEnabled: Enables or disables line-by-line metric collection

Advanced Usage Example

Here is a more complete example (available in the dc.codemonitor.Example class):

ClassMethod MonitorGenerateNumber(parameters As %DynamicObject) As %Status
{
    Set sc = $$$OK
    Try {
        // Display received parameters
        Write "* Parameters:", !
        Set formatter = ##class(%JSON.Formatter).%New()
        Do formatter.Format(parameters)
        Write !
        
        // Create and configure the monitor
        Set monitor = ##class(dc.codemonitor.MonLBL).%New()
        
        // WARNING: In production, set autoCompile to $$$NO
        // and manually compile the code to monitor
        Set monitor.autoCompile = $$$YES
        Set monitor.metricsEnabled = $$$YES
        Set monitor.directory = ##class(%File).NormalizeDirectory(##class(%SYS.System).TempDirectory())
        Set monitor.decimalPointIsComma = $$$YES

        // Configure the routine to monitor ("int" form of the class)
        // To find the exact routine name, use the command:
        // Do $SYSTEM.OBJ.Compile("dc.codemonitor.DoSomething","ck")
        // The line "Compiling routine XXX" will give you the routine name
        Set monitor.routines = $ListBuild("dc.codemonitor.DoSomething.1")

        // Start monitoring
        $$$TOE(sc, monitor.startMonitoring())
        
        // Execute the code to monitor with error handling
        Try {
            Do ##class(dc.codemonitor.DoSomething).GenerateNumber(parameters.Number)

            // Important: Always stop monitoring
            Do monitor.stopMonitoring()
        }
        Catch ex {
            // Stop monitoring even in case of error
            Do monitor.stopMonitoring()
            Throw ex
        }
    }
    Catch ex {
        Set sc = ex.AsStatus()
        Do $SYSTEM.Status.DisplayError(sc)
    }

    Return sc
}

This example demonstrates several important best practices:

  • Using a Try/Catch block for error handling
  • Systematically stopping monitoring, even in case of error
  • Complete monitor configuration

Example with CSP Pages

MonLBL also allows monitoring CSP pages. Here is an example (also available in the dc.codemonitor.ExampleCsp class):

ClassMethod MonitorCSP(parameters As %DynamicObject = {{}}) As %Status
{
    Set sc = $$$OK
    Try {
        // Display received parameters
        Write "* Parameters:", !
        Set formatter = ##class(%JSON.Formatter).%New()
        Do formatter.Format(parameters)
        Write !
        
        // Create and configure the monitor
        Set monitor = ##class(dc.codemonitor.MonLBL).%New()
        Set monitor.autoCompile = $$$YES
        Set monitor.metricsEnabled = $$$YES
        Set monitor.directory = ##class(%File).NormalizeDirectory(##class(%SYS.System).TempDirectory())
        Set monitor.decimalPointIsComma = $$$YES

        // To monitor a CSP page, use the generated routine
        // Example: /csp/user/menu.csp --> class: csp.menu --> routine: csp.menu.1
        Set monitor.routines = $ListBuild("csp.menu.1")

        // CSP pages require %session, %request, and %response objects
        // Create these objects with the necessary parameters
        Set %request = ##class(%CSP.Request).%New()
        // Configure request parameters if necessary
        // Set %request.Data("<param_name>", 1) = <value>
        Set %request.CgiEnvs("SERVER_NAME") = "localhost"
        Set %request.URL = "/csp/user/menu.csp"

        Set %session = ##class(%CSP.Session).%New(1234)
        // Configure session data if necessary
        // Set %session.Data("<data_name>", 1) = <value>

        Set %response = ##class(%CSP.Response).%New()
            
        // Start monitoring
        $$$TOE(sc, monitor.startMonitoring())
        
        Try {
            // To avoid displaying the CSP page content in the terminal,
            // use the IORedirect class to redirect output to null
            // (requires installation via zpm "install io-redirect")
            Do ##class(IORedirect.Redirect).ToNull() 
            
            // Call the CSP page via its OnPage method
            Do ##class(csp.menu).OnPage()
            
            // Restore standard output
            Do ##class(IORedirect.Redirect).RestoreIO()

            // Stop monitoring
            Do monitor.stopMonitoring()
        }
        Catch ex {
            // Always restore output and stop monitoring in case of error
            Do ##class(IORedirect.Redirect).RestoreIO()
            Do monitor.stopMonitoring()
           
            Throw ex
        }
    }
    Catch ex {
        Set sc = ex.AsStatus()
        Do $SYSTEM.Status.DisplayError(sc)
    }

    Return sc
}

Key points for monitoring CSP pages:

  1. Routine Identification: A CSP page is compiled into a class and a routine. For example, /csp/user/menu.csp generates the class csp.menu and the routine csp.menu.1.

  2. CSP Environment: It is necessary to create CSP context objects (%request, %session, %response) for the page to execute correctly.

  3. Output Redirection: To avoid displaying HTML content in the terminal, you can use the IORedirect utility (available on OpenExchange via zpm "install io-redirect").

  4. Page Call: Execution is done via the OnPage() method of the generated class.

Example Output

Here is an example of the output obtained when executing the MonitorGenerateNumber method:

USER>d ##class(dc.codemonitor.Example).MonitorGenerateNumber({"number":"100"})
* Parameters:
{
  "number":"100"
}

* Metrics are exported to /usr/irissys/mgr/Temp/dc.codemonitor.DoSomething.1.csv
* Perf results:
{
  "startDateTime":"2025-05-07 18:45:42",
  "systemCPUTime":0,
  "userCPUTime":0,
  "timing":0.000205,
  "lines":19,
  "gloRefs":14,
  "diskReadInMs":"0"
}

In this output, we can observe:

  1. Display of input parameters
  2. Confirmation that metrics were exported to a CSV file
  3. A summary of global performance in JSON format, including :
    • Start date and time
    • System and user CPU time
    • Total execution time
    • Number of executed lines
    • Number of global references
    • Disk read time

Interpreting CSV Results

After execution, CSV files (one per routine in the $ListBuild routines) are generated in the configured directory. These files contain:

  • Line number
  • Metrics collected for each line
  • Source code of the line (note: if you did not compile with the "k" flag, the source code will not be available in the CSV file)

Here is an example of the content of an exported CSV file (dc.codemonitor.DoSomething.1.csv):

LineRtnLineGloRefTimeTotalTimeCode
10000 ;dc.codemonitor.DoSomething.1
20000 ;Generated for class dc.codemonitor.DoSomething...
30000 ;;59595738;dc.codemonitor.DoSomething
40000 ;
50000GenerateNumber(n=1000000) methodimpl {
6100.0000050.000005 For i=1:1:n {
710000.0000190.000019 Set number = $Random(100000)
810000.0000150.000015 Set isOdd = number # 2
910000.0000130.000013 }
10100.0000030.000003 Return }

In this table, we can analyze:

  • RtnLine: Indicates how many times each line was executed (here, lines 6 and 10 were executed once)
  • GloRef: Shows the global references generated by each line
  • Time: Presents the execution time specific to each line
  • TotalTime: Displays the total time, including calls to other routines

These data can be easily imported into a spreadsheet for in-depth analysis. The most resource-intensive lines in terms of time or data access can thus be easily identified.

Note on Cache Efficiency

The efficiency of the database cache (global buffer) can mask real performance issues. During analysis, data access may appear fast due to this cache but could be much slower under certain real-world usage conditions.

On development systems, you can clear the cache between measurements with the following command:

Do ClearBuffers^|"%SYS"|GLOBUFF()

⚠️ WARNING: Be cautious with this command, as it applies to the entire system. Never use it in a production environment, as it could impact the performance of all running applications.

Conclusion

Line-by-line monitoring is a valuable tool for analyzing ObjectScript code performance. By precisely identifying the lines of code that consume the most resources, it allows developers to save significant time in analyzing performance bottlenecks.

1
2 209
Question Anna Golitsyna · Jun 6, 2025

Let's suppose two different routines use one and the same chunk of code. From the object-oriented POV, a good decision is to have this chunk of code in a separate class and have both routines call it. However, whenever you call code outside of the routine as opposed to calling code in the same routine, some execution speed is lost. For reports churning through millions of transactions this lost speed might be noticeable. Any advice how to optimize specifically speed?P.S. Whenever someone is talking about the best choice for whatever, I am always tempted to ask: "What are we optimizing?".

14
0 157
Article Lorenzo Scalese · Apr 8, 2025 10m read

Introduction

Database performance has become a critical success factor in a modern application environment. Therefore identifying and optimizing the most resource-intensive SQL queries is essential for guaranteeing a smooth user experience and maintaining application stability. 

This article will explore a quick approach to analyzing SQL query execution statistics on an InterSystems IRIS instance to identify areas for optimization within a macro-application.

Rather than focusing on real-time monitoring, we will set up a system that collects and analyzes statistics pre-calculated by IRIS once an hour.  This approach, while not enabling instantaneous monitoring, offers an excellent compromise between the wealth of data available and the simplicity of implementation. 

We will use Grafana for data visualization and analysis, InfluxDB for time series storage, and Telegraf for metrics collection.  These tools, recognized for their power and flexibility, will allow us to obtain a clear and exploitable view.

More specifically, we will detail the configuration of Telegraf to retrieve statistics. We will also set up the integration with InfluxDB for data storage and analysis, and create customized dashboards in Grafana. This will help us quickly identify queries requiring special attention.

To facilitate the orchestration and deployment of these various components, we will employ Docker.

logos.png

0
3 272
Article Luis Angel Pérez Ramos · Mar 11, 2025 53m read

Since the introduction of Embedded Python there has always been doubt about its performance compared to ObjectScript and on more than one occasion I have discussed this with @Guillaume Rongier , well, taking advantage of the fact that I was making a small application to capture data from public competitions in Spain and to be able to perform searches using the capabilities of VectorSearch I saw the opportunity to carry out a small test.

Data for the test

Public tender information is provided monthly in XML files from this URL  and the typical format of a tender information is as follows:

6
1 261
Article Daniel Cole · Feb 14, 2025 5m read

InterSystems has been at the forefront of database technology since its inception, pioneering innovations that consistently outperform competitors like Oracle, IBM, and Microsoft. By focusing on an efficient kernel design and embracing a no-compromise approach to data performance, InterSystems has carved out a niche in mission-critical applications, ensuring reliability, speed, and scalability.

A History of Technical Excellence

4
2 439
Question Gabriel Silva dos Santos · Jan 17, 2025

Hello everyone,

I’m facing issues with replicating data from my Caché 2016 database to a PostgreSQL database. I need to handle around 300 data updates per minute, and whenever certain tables are modified, those changes must be reflected in other databases.

So far, I’ve tried various approaches, including:

  • Setting up an intermediary API,
  • Using Azure Service Bus,
  • Leveraging Caché Jobs,
  • All of which rely on table triggers as the entry point.
6
0 155
Article Ben Schlanger · May 7, 2025 4m read

Here at InterSystems, we often deal with massive datasets of structured data. It’s not uncommon to see customers with tables spanning >100 fields and >1 billion rows, each table totaling hundred of GB of data. Now imagine joining two or three of these tables together, with a schema that wasn’t optimized for this specific use case. Just for fun, let’s say you have 10 years worth of EMR data from 20 different hospitals across your state, and you’ve been tasked with finding….   every clinician within your network      who has administered a specific drug         between the years of 2017-2019

1
3 225
Article Ben Spead · Jan 11, 2019 4m read

There are three things most important to any SQL performance conversation:  Indices, TuneTable, and Show Plan.  The attached PDFs includes historical presentations on these topics that cover the basics of these 3 things in one place.  Our documentation provides more detail on these and other SQL Performance topics in the links below.  The eLearning options reinforces several of these topics.  In addition, there are several Developer Community articles which touch on SQL performance, and those relevant links are also listed.

There is a fair amount of repetition in the information listed below.  The most important aspects of SQL performance to consider are:

  1. The types of indices available
  2. Using one index type over another
  3. The information TuneTable gathers for a table and what it means to the Optimizer
  4. How to read a Show Plan to better understand if a query is good or bad
3
9 1214
Article Yuri Marx · Nov 27, 2024 8m read

The rise of Big Data projects, real-time self-service analytics, online query services, and social networks, among others, have enabled scenarios for massive and high-performance data queries. In response to this challenge, MPP (massively parallel processing database) technology was created, and it quickly established itself. Among the open-source MPP options, Presto (https://prestodb.io/) is the best-known option. It originated in Facebook and was utilized for data analytics, but later became open-sourced. However, since Teradata has joined the Presto community, it offers support now.

0
3 290
Question Norman W. Freeman · Nov 15, 2024

I use the following code to calculate the SHA1 of a file :

set stream = ##class(%Stream.FileBinary).%New()
do stream.LinkToFile(filename)
write$SYSTEM.Encryption.Base64Encode($SYSTEM.Encryption.SHA1HashStream(stream))

This code is called thousands of time and performance is critical. I have tried to code same logic in another language (which is lower level) and it's almost twice as fast. It's unclear why so I started investigating.

2
0 205
InterSystems Official Thomas Dyar · Oct 3, 2024

We've recently made available a new version of InterSystems IRIS in the Vector Search Early Access Program, featuring a new Approximate Nearest Neighbor index based upon the Hierarchical Navigable Small World (HNSW) indexing algorithm. This addition allows for highly efficient, approximate nearest-neighbor searches over large vector datasets, dramatically improving query performance and scalability.

1
1 290