#Analytics

0 Followers · 286 Posts

This tag relates to the discussions on the development of analytics and business intelligence solutions, visualization, KPI and other business metrics management.

Article Renato Banzai · Jun 1, 2020 4m read

Making a Chart using Intersystems IRIS + Python

How to use the IRIS Native API in Python to access globals and plot some charts.

Why Python?

With a large adoption and use in the world, Python have a great community and a lot of accelerators | libraries to deploy any kind of application. If you are curious (https://www.python.org/about/apps/)

Why COVID-19 Data

As the pandemy evolves in the world a lot of information are being spreaded so I decided to create an application to audit those information. Unfortunately each country has a different test policy so I decided to use the death data to avoid the cases subnotifications.

Chart options:

  • Linear: Using linear y axis
  • Log: Using a logathmic y axis as the infection grows exponentially
  • Days after the first death: Align all 1st deaths country in the same time series
  • Real Timeline: With the real date of each report
  • Rate: Consider the population of the country
  • Total Deaths: Consider just the number of deaths

The Chart Application

picture

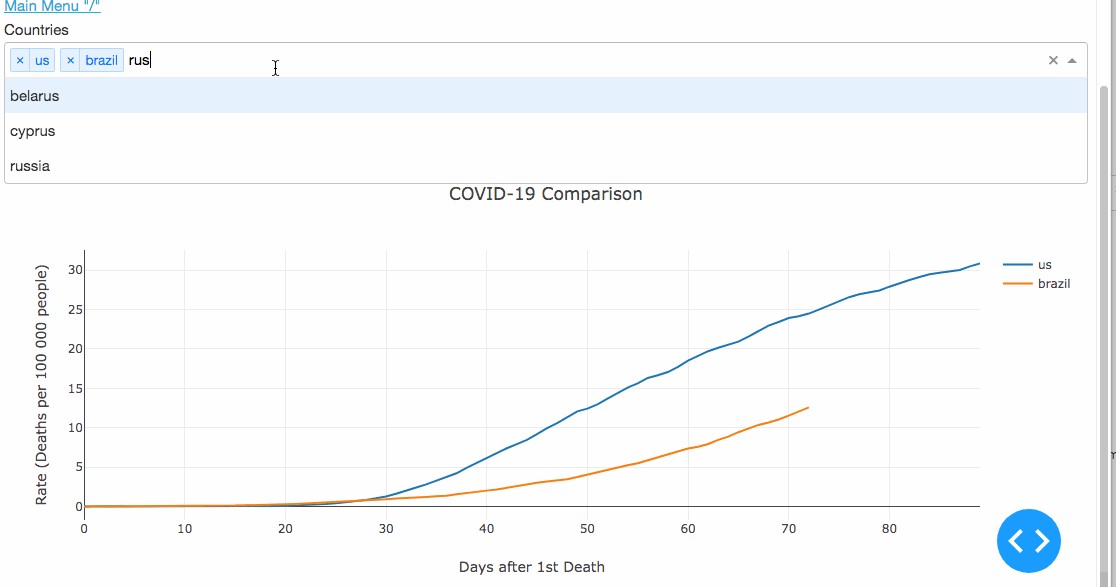
Demo - Try it yourself

I have deployed the application as a demo here: (http://iris-python-suite.eastus.cloudapp.azure.com/covid19-chart)

Take a look the code

Clone my repository to see all the code implementation.

git clone https://github.com/renatobanzai/iris-python-covid19.git

What did I use in Python

In this application environment I use Python 3.7 with these modules.

  • PyYAML==5.3.1
  • dash==1.12.0
  • plotly==4.7.1
  • irisnative-1.0.0-cp34-abi3-linux_x86_64.whl

Project Structure

This project has a simple structure to be easy to understand. On the main folder we have 3 most important subfolders:

  • ./app: with all the application code and installing configuration.
  • ./iris: with the InterSystems IRIS dockerfile preparing to serve the application.
  • ./data: with the files from Johns Hopkins University to ingest and a YAML to change configuration outside the container environment by a volume

Application Structure

Now inside the ./app directory we can see some files:

  • __main__.py : with the implementation of the web application
  • iriscovid19.py : a class performing all data interaction

Database Structure

This application uses Intersystems IRIS as a repository, the globals used are:

-^config : with some config data -^raw.covid19 : where the raw data (Source of Data) are ingested -^countrydetails : to get the population of each country -^end.date.deaths : to serve the chart requisitions and here is the goal, Its fast! -^end.timeless.deaths : to server another kind of chart requisition

What the python code does?

The python get the csv files from ../data folder and ingest into the globals ^raw.covid19, ^countrydetails. After this perform a data prep using the globals and generating a ready to use data to plot the charts. After this a web app goes up to you interact with the graph as you desire.

How to perform joins between globals?

The paradigm in this case is quite different from the SQL Patterns. To perform joins, I ingested the data in a format that can be used as a index to merge the globals. e.g:

#{country_index} is only an example

^raw.covid19("countries","{country_index}","deaths")
^countrydetails("{country_index}","population")

If for some reason you need to use the population of a country its prepared to get with one .get() method.

Running the application by yourself

Prerequisites

  • git
  • docker and docker-compose
  • acess to a terminal in your environment

Steps

With docker-compose you can easily up one environment with all the pieces and configurations go to the iris-python-covid19 folder and type this:

$ docker compose up

Estimated time to up containers

1st time running will depend of your internet link to download the images and dependencies. If it last more than 15 minutes probably something goes wrong feel free to communicate here. After the 1st time running the next ones will perform better and take less then 2 minutes.

If is everything ok

After a while you can open your browser and go to the address:

http://localhost:8050

Main Menu

The project has a main menu that points you to the functionalities:

  • COVID-19 Chart Example "/covid19-chart": A interactive chart using globals + Python
  • Global CRUD Example "/config-CRUD": A demonstration of a Globals CRUD
  • Reset Data (Dont Panic!) "/reset-data": If you want to re-perform the start-up applications process

You should look at IRIS Admin Portal

I'm using for now the USER namespace

http://localhost:9092
user: _SYSTEM
pass: theansweris42

Demo

I deployed this application on (http://iris-python-suite.eastus.cloudapp.azure.com/covid19-chart)http://iris-python-suite.eastus.cloudapp.azure.com/covid19-chart

If this article help you or you like the content vote:

This application is at the current contest on open exchange, you can vote in my application iris-python-suite here(https://openexchange.intersystems.com/contest/current)

1
0 500
InterSystems Official Thomas Dyar · May 27, 2020

Preview releases are now available for InterSystems IRIS Advanced Analytics, and InterSystems IRIS for Health Advanced Analytics! The Advanced Analytics add-on for InterSystems IRIS introduces IntegratedML as a key new feature.

The build number for these releases is: 2020.3.0AA.331.0

Full product installation kits, container images, and evaluation license keys are available via the WRC's preview download site.

Community Edition containers can also be pulled from the Docker store using the following commands:

1
3 653
Article Henry Pereira · Sep 16, 2019 6m read

In an ever-changing world, companies must innovate to stay competitive. This ensures that they’ll make decisions with agility and safety, aiming for future results with greater accuracy.
Business Intelligence (BI) tools help companies make intelligent decisions instead of relying on trial and error. These intelligent decisions can make the difference between success and failure in the marketplace.
Microsoft Power BI is one of the industry’s leading business intelligence tools. With just a few clicks, Power BI makes it easy for managers and analysts to explore a company’s data. This is important because when data is easy to access and visualize, it’s much more like it’ll be used to make business decisions. 


8
2 3050
Announcement Anastasia Dyubaylo · Apr 16, 2020

Hi Community,

We're pleased to invite you to join the upcoming InterSystems IRIS 2020.1 Tech Talk: Data Science, ML & Analytics on April 21st at 10:00 AM EDT!

In this first installment of InterSystems IRIS 2020.1 Tech Talks, we put the spotlight on data science, machine learning (ML), and analytics. InterSystems IntegratedMLTM brings automated machine learning to SQL developers. We'll show you how this technology supports feature engineering and chooses the most appropriate ML model for your data, all from the comfort of a SQL interface. We'll also talk about what's new in our open analytics offerings. Finally, we'll share some big news about InterSystems Reports, our "pixel-perfect" reporting option. See how you can now generate beautiful reports and export to PDF, Excel, or HTML.


2
1 469
Announcement Eduard Lebedyuk · Apr 10, 2020

I'm happy to announce the release of the interface to Julia programming language for InterSystems IRIS. Execute Julia code and more from InterSystems IRIS. This project brings you the power of Julia right into your InterSystems IRIS environment:

  • Execute arbitrary Julia code
  • Seamlessly transfer data from InterSystems IRIS into Julia
  • Build intelligent Interoperability business processes with Julia Interoperability Adapter
  • Experiment in Julia Shell, right inside your InterSystems IRIS terminal

Julia Gateway is a community project, available on OpenExchange. Julia Gateway is available on Windows, Linux, Mac and Docker.

Here's some screenshots:

Webinar

Want to learn more? Visit our webinar!

Foo

We invite you to the "Best practices of in-platform AI/ML" webinar by InterSystems on April 28th at 11 :00 Boston time.

Productive use of machine learning and artificial intelligence technologies is impossible without a platform that allows autonomous functioning of AI/ML mechanisms. In-platform AI/ML has a number of advantages that can be obtained via best practices by InterSystems.

On our webinar, we will present:

  • MLOps as the natural paradigm for in-platform AI/ML - Aleksandar Kovacevic
  • Full cycle of AI/ML content development and in-platform deployment (including bidirectional integration of Jupyter with InterSystems IRIS) - Eduard Lebedyuk
  • New toolset added to ML Toolkit: integration and orchestration for Julia mathematical modeling environment - Eduard Lebedyuk
  • Automated AI/ML model selection and parameter determination via an SQL query – Sergey Lukyanchikov
  • Cloud-enhanced ML - Anton Umnikov
  • Featured use case demo: hospital readmission prediction (addresses running in InterSystems IRIS of the models trained outside the platform's control) - David Lepzelter

The webinar will be useful for anyone interested in productive AI/ML implementation.

We will be happy to talk to you at our webinar!

Register!

0
0 300
Article Evgeny Shvarov · Nov 3, 2017 3m read

There are several options how to deliver user interface(UI) for DeepSee BI solutions. The most common approaches are:

  • use native DeepSee Dashboards, get web UI in Zen and deliver it in your web apps.
  • use DeepSee REST API, get and build your own UI widgets and dashboards.

The 1st approach is good because of the possibility to build BI dashboards without coding relatively fast, but you are limited with preset widgets library which is expandable but with a lot of development efforts.

The 2nd provides you the way to use any comprehensive js framework (D3, Highcharts, etc) to visualize your DeepSee data, but you need to code widgets and dashboards on your own.

Today I want to tell you about yet another approach which combines both listed above and provides Angular based web UI for DeepSee Dashboards -  DeepSee Web library.

16
5 2573
Article Peter Steiwer · Mar 2, 2020 2m read

This error is sometimes seen while viewing a listing in InterSystems IRIS Business Intelligence:
ERROR #5540: SQLCODE: -99 Message: User <USERNAME> is not privileged for the operation (4)  

As the error suggests, this is due to a permission error. To figure out which permissions are missing/needed, we can take a look at the SQL query that is generated. We will use a query from SAMPLES as an example.

0
0 1233
Article Peter Steiwer · Feb 25, 2020 1m read

Preview Mode was added to InterSystems IRIS Business Intelligence to give designers a quick view of what their resulting Pivot Table will look like without needing to wait for the results to fully execute. This can be beneficial when designing pivot tables because if you are dragging and dropping elements to see how they look/work in your pivot table and seeing if they have the desired data. Since you are exploring and designing, you don't necessarily care about the results at the moment, but you would still like to see how your table looks with the changes you have made.

0
0 409
Article Peter Steiwer · Feb 25, 2019 1m read

AnalyzeThis is a tool for getting a personalized preview of your own data inside of InterSystems BI. This allows you to get first hand experience with InterSystems BI and understand the power and value it can bring to your organization. In addition to getting a personalized preview of InterSystems BI through an import of a CSV file with your data, Classes and SQL Queries are now supported as Data Sources in v1.1.0!

4
0 648
Article Tony Coffman · Feb 6, 2020 1m read

Hello Community,

Thank you all for your continued feedback and support of our ad hoc reporting platform, VDM.  There's been some questions around setting up a non-ODBC connection for InterSystems platforms.  We published a new YouTube video showing the steps necessary to connect to InterSystems Caché and InterSystems IRIS with BridgeWorks VDM. 

0
3 270
Article Peter Steiwer · Dec 12, 2019 2m read

DeepSeeButtons is available on Open Exchange! This tool will generate a diagnostic report of your DeepSee environment.

The report consists of multiple sections. These sections range from System Details to Caché/InterSystems IRIS logs to Cube information. In addition to simply providing information about the environment, some common recommended configurations are checked. If a recommended configuration is not used, an alert is displayed highlighting that the environment configuration does not match the recommended configuration.

1
0 526
Question Rodrigo Flores · Jan 21, 2020

Hi there,
We need your help, in the build pivot with DMX, we don't can run the pivot. The MDX use is:

WITH MEMBER [Measures].[CondicionesContCompleta] AS (     IIf([Measures].[CondicionesContCompleta] = Null, 0,[Measures].[CondicionesContCompleta] ) ) SELECT NON EMPTY (     [Gerencia].Gerencia].[Gerencia] ) ON ROWS, NON EMPTY (     [Measures].[CondicionesContCompleta] ) ON COLUMNS FROM [Condiciones]

and when we executed the pivot display the next dialog.

Error#5001: Expected  operator within tuple: ('SELECT' @pos 156)(2)

7
0 339
Article Peter Steiwer · Jan 14, 2020 2m read

In the previous part of this series, we saw how to include data in a portlet from within DeepSee. This used the built in data controller. In this part, we are going to be pulling in data from outside of DeepSee. This will include both information from within InterSystems IRIS and from the OS.

Why use this?

This is useful if you would like to create a dashboard that only contains information about your system. It is also useful if you want to display data about your system along side data that you have stored in DeepSee.

What will we learn?

0
0 370
Article Peter Steiwer · Jan 10, 2020 4m read

When using Related Cubes in InterSystems IRIS BI, cubes must be built in the proper order. The One side must be built before the Many side. This is because during build time for the Many side, it looks up the record on the One side and creates a link. If the referenced record is not found on the One side, a Missing Relationship build error is generated. The One side is going to be the independent side of the relationship, AKA the side of the relationship that is referenced by the Many side or the Dependent cube. For example: Patients contain a reference to their Doctor. The Doctor does not

0
0 572
Article Peter Steiwer · Jan 6, 2020 4m read

What is %SQLRESTRICT

%SQLRESTRICT is a special %FILTER clause for use in MDX queries in InterSystems IRIS Business Intelligence. Since this function begins with %, it means this is a special MDX extension created by InterSystems. It allows users to insert an SQL statement that will be used to restrict the returned records in the MDX Result Set. This SQL statement must return a set of Source Record IDs to limit the results by. Please see the documentation for more information.

Why is this useful?

This is useful because there are often times users want to restrict the results in their MDX Result Set based on information that is not in their cubes. It may be the case that this information may not make sense to be in the cube. Other times this can be useful when there is a large set of values you want to restrict. As mentioned before, this is not a standard MDX function, it was created by InterSystems to handle cases were queries were not performing well or cases that were not easily solved by existing functions.

0
2 706
Article Peter Steiwer · Dec 31, 2019 3m read


In the previous part of this series, we saw how to reference a web page that will enhance our dashboard experience.  Now we will look into referencing data that is already in our cubes.

In this example, we will be referencing the controller object and we will be extracting data from it. This data will then be displayed as text in our Dashboard. In Part 5, we will show how to incorporate this data into other charting libraries.

Why use this?

0
0 289
Article Peter Steiwer · Dec 16, 2019 3m read

In the previous part of this series, we saw how to define a basic portlet. Now we will look into making this portlet reference a web page that will enhance our dashboard experience.

In this example, we will be embedding a Developer Community article along side a couple of widgets displaying information related to the number of views on the Developer Community articles. This example is not hosted on the Community Analytics server, but if it was we could see the view counts going up as we interacted with the page.

Why use this?

In a real case, perhaps you have an embedded page from an external web site showing the current Emergency Room wait times for Hospitals in your area. This portlet can be used along side widgets from your Emergency Room showing how many people are waiting, how many doctors are active, and how many people are being treated. As other Emergency Room wait times grow, you can possibly expect your volume to increase as well. This can help you make decisions on how to allocate resources.

0
0 449
Announcement Benjamin De Boe · Jan 8, 2019

Hi, 

As we announced at our Global Summit in October, we are developing dedicated connectors for a number of third-party data visualization tools for InterSystems IRIS. With these connectors, we want to combine an excellent user experience with optimal performance when using those tools to visualize data managed on InterSystems IRIS Data Platform.

3
0 1004
Article Peter Steiwer · Dec 12, 2019 2m read

What is a portlet?

The simple answer is: a custom widget. A portlet can exist by itself on a DeepSee dashboard, it can be used along side standard DeepSee widgets, or along side other portlets. The rendering of the custom widget is completely user defined. This means you can embed a web page, create a form to perform any sort of action needed based on the data on your dashboard, use third party charting libraries, or simply display data from outside of a DeepSee cube.

How to get started

1
0 559
Announcement Tony Coffman · Nov 20, 2019

Hello InterSystems Community,

We're excited to announce that we've completed our first Open Exchange submission for InterSystems platforms.

BridgeWorks VDM is an ad hoc reporting and graphical SQL query builder application that was designed for any user who needs access to their SQL projections in InterSystems Caché, InterSystems IRIS, InterSystems IRIS for Health databases as well as access to InterSystems DeepSee and InterSystems IRIS BI Cubes with minimal SQL scripting experience.  

VDM features:

0
1 533
Article Peter Steiwer · Nov 19, 2019 3m read

Why log in to view pivot tables when you can have them delivered directly to your inbox? Are you in need of automated reporting for InterSystems IRIS Business Intelligence? Pivot Subscriptions is your solution: a tool for subscribing to scheduled email reports of pivot tables inside InterSystems IRIS Business Intelligence (previously known as DeepSee).

0
1 576