#Best Practices

0 Followers · 298 Posts

Best Practices recommendations on how to develop, test, deploy and manage solutions on InterSystems Data Platforms better. 

InterSystems staff + admins Hide everywhere
Hidden post for admin
Article Peter Cooper · Mar 13, 2018 3m read

Index to Articles

Hi All

I am an avid user of ZEN for over 10 years now and it works for me.
But it seems that Intersystems are no longer actively developing it (or ZEN Mojo), the only published reference to this  is here

As an aside, Intersystems makes fine products (I have been using the technology for 35 years) and has great support BUT they are not good at being open with their product road map/retirement plans.  This is very embarrassing  to me when talking with my end user clients.

10
1 2028
Article Mark Bolinsky · Mar 21, 2017 4m read

Database systems have very specific backup requirements that in enterprise deployments require forethought and planning. For database systems, the operational goal of a backup solution is to create a copy of the data in a state that is equivalent to when application is shut down gracefully.  Application consistent backups meet these requirements and Caché provides a set of APIs that facilitate the integration with external solutions to achieve this level of backup consistency.

7
2 2893
Article Joel Solon · Oct 30, 2019 4m read

A few years ago, I was teaching the basics of our %UnitTest framework during Caché Foundations class (now called Developing Using InterSystems Objects and SQL). A student asked if it was possible to collect performance statistics while running unit tests. A few weeks later, I added some additional code to the %UnitTest examples to answer this question. I’m finally sharing it on the Community.

2
2 714
Article Murray Oldfield · Mar 25, 2016 14m read

This week I am going to look at CPU, one of the primary hardware food groups :) A customer asked me to advise on the following scenario; Their production servers are approaching end of life and its time for a hardware refresh. They are also thinking of consolidating servers by virtualising and want to right-size capacity either bare-metal or virtualized. Today we will look at CPU, in later posts I will explain the approach for right-sizing other key food groups - memory and IO.

So the questions are:

  • How do you translate application requirements on a processor from more than five years ago to todays processors?
  • Which of the current processors are suitable?
  • How does virtualization effect CPU capacity planning?

Added June 2017: For a deeper dive into the specifics of VMware CPU considerations and planning and some common questions and problems, please also see this post: Virtualizing large databases - VMware cpu capacity planning


[A list of other posts in this series is here](https://community.intersystems.com/post/capacity-planning-and-performance-series-index)

Comparing CPU performance using spec.org benchmarks

To translate CPU usage between processor types for applications built using InterSystems data platforms (Caché, Ensemble, HealthShare) you can use SPECint benchmarks as a reliable back of the envelope calculator for scaling between processors. The http://www.spec.org web site has trusted results of a standardised set of benchmarks that are run by hardware vendors.

Specifically SPECint is a way to compare processors between processor models from the same vendors and between different vendors (e.g. Dell, HP, Lenovo, and Intel, AMD, IBM POWER and SPARC). You can use SPECint to understand the expected CPU requirements for your application when hardware is to be upgraded or if your application will be deployed on a range of different customer hardware and you need to set a baseline for a sizing metric, for example peak transactions per CPU core for Intel Xeon E5-2680 (or whatever processor you choose).

There are several benchmarks used on the SPECint web site, however the SPECint_rate_base2006 results are the best for Caché and have been confirmed over many years looking at customer data and in our own benchmarks.

As an example in this post we will compare the difference between the customers Dell PowerEdge server running Intel Xeon 5570 processors and a current Dell server running Intel Xeon E5-2680 V3 processors. The same methodology can be applied when Intel Xeon V4 server processors are generally available (expected soon as I write this in early 2016).

Example: Comparing processors

Search the spec.org database for the SPECint2006_Rates for processor name, for example E5-2680 V3, further refine your search results if your target server make and model is known (e.g Dell R730), otherwise use a popular vendor, I find Dell or HP models are good baselines of a standard server, there is not usually much variance between processors on different vendor hardware.

At the end of this post I walk through a step by step example of searching for results using the spec.org web site…

Lets assume you have searched spec.org and have found the existing server and a possible new server as follows:

Existing: Dell PowerEdge R710 with Xeon 5570 2.93 GHz: 8 cores, 2 chips, 4 cores/chip, 2 threads/core: SPECint_rate_base2006 = 251

New: PowerEdge R730 with Intel Xeon E5-2680 v3, 2.50 GHz: 24 cores, 2 chips, 12 cores/chip, 2 threads/core: SPECint_rate_base2006 = 1030

Not surprisingly the newer 24-core server has more than 4x increase in SPECint_rate_base2006 benchmark throughput of the older 8-core server even though the newer server has a lower clock speed. Note the examples are two-processor servers that have both processor sockets populated.

Why is SPECint_rate_base2006 used for Caché?

The spec.org web site has explanations of the various benchmarks, but the summary is the SPECint_rate2006 benchmark is a complete system-level benchmark uses all CPUs with hyper threading.

Two metrics are reported for a particular SPECint_rate2006 benchmark, base and peak. Base is a conservative benchmark, peak is aggressive. For capacity planning use SPECint_rate_base2006 results.

Does four times the SPECint_rate_base2006 mean four times the capacity for users or transactions?

Its possible that if all 24 cores were used the application throughput could scale to four times the capability of the old server. However several factors can cause this milage to vary. SPECint will get you in the ballpark for sizing and throughput that should be possible, but there are a few caveats.

While SPECint gives a good comparison between the two servers in the example above it is not a guarantee that the E5-2680 V3 server will have 75% more capacity for peak concurrent users or peak transaction throughput as the older Xeon 5570 based server. Other factors come into play such as whether the other hardware components in our food groups are upgraded, for example is the new or existing storage capable of servicing the increase in throughput (I will have an in-depth post on storage soon).

Based on my experience benchmarking Caché and looking at customers performance data Caché is capable of linear scaling to extremely high throughput rates on a single server as compute resources (CPU cores) are added, even more so with the year on year improvements in Caché. Put another way I see linear scaling of maximum application throughput, for example application transactions or reflected in Caché glorefs as CPU cores are added. However if there are application bottlenecks they can start to appear at higher transaction rates and impact liner scaling. In later posts I will look at where you can look for symptoms of application bottlenecks. One of the best things you can do to improve application performance capability is to upgrade Caché to the latest version.

Note: For Caché, Windows 2008 servers with more than 64 logical cores are not supported. For example, a 40 core server must have hyper threading disabled. For Windows 2012 up to 640 logical processors are supported. There is no limits on Linux.

How many cores does the application need?

Applications vary and you know your own applications profile, but the common approach I use when capacity planning CPU for a server (or Virtual Machine) is from diligent system monitoring understanding that a certain number of CPU cores of a certain 'standard' processor can sustain a peak transaction rate of n transactions per minute. These may be episodes, or encounters, lab tests, or whatever makes sense in your world. The point is that the throughput of the standard processor is be based on metrics you have collected on your current system or a customers systems.

If you know your peak CPU resource use today on a known processor with n cores, you can translate to the number of cores required on a newer or different processor for the same transaction rate using the SPECint results. With expected linear scaling 2 x n transactions per minute roughly translates to 2 x the number of cores are required.

Selecting a processor

As you see from the spec.org web site or looking at your preferred vendor offerings there are many processor choices. The customer in this example is happy with Intel, so if I stick with recommending current Intel servers then one approach is to look for 'bang for buck' - or SPECint_rate_base2006 per dollar and per core. For example the following chart plots Dell commodity servers - your price milage will vary, but this illustrates the point there are sweet spots in price and higher core counts suitable for consolidation of servers using virtualization. I created the chart by pricing a production quality server, for example Dell R730, and then looking at different processor options.

mo

Based on the data in the chart and experience at customers sites the E5-2680 V3 processor shows good performance and a good price point per SPECint or per core.

Other factors come into play as well, for example if you are looking at server processors for virtualized deployment it may be cheaper to increase the core count per processor at increased cost but with the effect of lowering the total number of host servers required to support all your VMs, therefore saving on software (e.g. VMware or Operating Systems) that licence per processor socket. You will also have to balance number of hosts against your High Availability (HA) requirements. I will revisit VMware and HA in later posts.

For example a VMware HA cluster made up of three 24-core host servers provides good availability and significant processing power (core count) allowing flexible configurations of production and non-production VMs. Remember VMware HA is sized at N+1 servers, so three 24-core servers equates to a total 48-cores available for your VMs.

Cores vs GHz - Whats best for Caché?

Given a choice between faster CPU cores versus more CPU cores you should consider the following:

  • If your application has a lot of cache.exe threads/processes required then more cores will allow more of these to run at exactly the same time.
  • If your application has fewer processes you want each to run as fast as possible.

Another way to look at this is that if you have a client/server application with many processes, say one (or more) per concurrent user you want more available cores. For browser based applications using CSP where users are bundled into fewer very busy CSP server processes your application would benefit from potentially fewer but faster cores.

In an ideal world both application types would benefit from many fast cores assuming there is no resource contention when multiple cache.exe processes are running in all those cores simultaneously. As I noted above, but worth repeating, every Caché release has improvements in CPU resource use, so upgrading applications to the latest versions of Caché can really benefit from more available cores.

Another key consideration is maximising cores per host when using virtualization. Individual VMs may not have high core counts but taken together you must strike a balance between number of hosts needed for availability and minimising the number of hosts for management and cost consideration by increasing core counts.

VMware virtualization and CPU

VMware virtualization works well for Caché when used with current server and storage components. By following the same rules as the physical capacity planning there is no significant performance impact using VMware virtualization on properly configured storage, network and servers. Virtulaization support is much better in later model Intel Xeon processors, specifically you should only consider virtualization on Intel Xeon 5500 (Nehalem) and later — so Intel Xeon 5500, 5600, 7500, E7-series and E5-series.


Example: Hardware refresh - calculating minimum CPU requirements

Putting together the tips and procedures above if we consider our example is a server upgrade of a workload running on Dell PowerEdge R710 with 8-cores (two 4-core Xeon 5570 processors).

By plotting the current CPU utilization on the primary production server at the customer we see that the server is peaking at less than 80% during the busiest part of the day. The run queue is not under pressure. IO and application is also good so there are no bottlenecks artificially surpassing suppressing CPU.

mo

Rule of thumb: Start by sizing systems for maximum 80% CPU utilization at end of hardware life taking into account expected growth (e.g. an increase in users/transactions). This allows for unexpected growth, unusual events or unexpected spikes in activity.

To make calculations clearer I let us assume no growth in throughput is expected over the life of the new hardware:

The per core scaling can be calculated as: (251/8) : (1030/24) or 26% increase in throughput per core.

80% CPU using 8-cores on the old server equates to roughly 80% CPU using 6-cores on the new E5-2680 V3 processors. So the same number of transactions could be supported on six cores.

The customer has a few choices, they can purchase new bare-metal servers which meet the minimum CPU requirement of six E5-2680 V3 or equivalent CPU cores, or move forward with their plans to virtualize their production workload on VMware.

Virtulaizing makes sense to take advantage of server consolidation, flexibility and high availability. Because we have worked out the CPU requirements the customer can move forward with confidence to right-size production VMs on VMware. As a sidebar buying current servers with low core counts is either difficult to source or expensive, which makes virtualization an even more attractive option.

Virtualising is also an advantage if significant growth is expected. CPU requirements can be calculated based on growth in the first few years. With constant monitoring a valid strategy is to add additional resources only as needed ahead of requiring them.


CPU and virtualization considerations

As we have seen production Caché systems are sized based on benchmarks and measurements at live customer sites. It is also valid to size VMware virtual CPU (vCPU) requirements from bare-metal monitoring. Virtualization using shared storage adds very little CPU overhead compared to bare-metal**. For production systems use a strategy of initially sizing the system the same as bare-metal CPU cores.

**Note: For VMware VSAN deployments you must add a host level CPU buffer of 10% for VSAN processing.

The following key rules should be considered for virtual CPU allocation:

Recommendation: Do not allocate more vCPUs than safely needed for performance.

  • Although large numbers of vCPUs can be allocated to a virtual machine, best practice is to not allocate more vCPUs than are needed as there can be a (usually small) performance overhead for managing unused vCPUs. The key here is to monitor your systems regularly to ensure VMs are right-sized.

Recommendation: Production systems, especially database servers, initially size for 1 physical CPU = 1 virtual CPU.

  • Production servers, especially database servers are expected to be highly utalized. If you need six physical cores, size for six virtual cores. Also see the note on hyper threading below.

Oversubscription

Oversubscription refers to various methods by which more resources than are available on the physical host can be assigned to the virtual servers that are supported by that host. In general, it is possible to consolidate servers by oversubscribing processing, memory and storage resources in virtual machines.

Oversubscription of the host is still possible when running production Caché databases, however for initial sizing of production systems assume is that the vCPU has full core dedication. For example; if you have a 24-core (2x 12-core) E5-2680 V3 server – size for a total of up to 24 vCPU capacity knowing there may be available headroom for consolidation. This configuration assumes hyper-threading is enabled at the host level. Once you have spent time monitoring the application, operating system and VMware performance during peak processing times you can decide if higher consolidation is possible.

If you are mixing non-production VMs a rule of thumb for system sizing to calculate total CPU cores I often use is to initially size non-Production at 2:1 Physical to Virtual CPUs. However this is definitely an area where milage may vary and monitoring will be needed to help you with capacity planning. If you have doubts or no experience you can separate production VMs from non-production VMs at the host level or by using vSphere configuration until workloads are understood.

VMware vRealize Operations and other third-party tools have the facility to monitor systems over time and suggest consolidation or alert that more resources are required for VMs. In a future post I will talk about more tools available for monitoring.

The bottom line is that in our customers example they can be confident that their 6 vCPU production VM will work well, of course assuming other primary food group components such as IO and storage have capacity ;)

Hyperthreading and capacity planning

A good starting point for sizing VMs based on known rules for physical servers is to calculate physical server CPU requirements for the target per processor with hyper-threading enabled then simply make the translation:

one physical CPU (includes hyperthreading) = one vCPU (includes hyperthreading).

A common misconception is that hyper-threading somehow doubles vCPU capacity. This is NOT true for physical servers or for logical vCPUs. As a rule of thumb hyperthreading on a bare-metal server may give a 30% additional performance capacity over the same server without hyperthreading. The same 30% rule applies to virtulized servers.

Licensing and vCPUs

In vSphere you can configure a VM to have a certain number of sockets or cores. For example, if you have a dual-processor VM, it can be configured so it has two CPU sockets, or that it has a single socket with two CPU cores. From an execution standpoint it does not make much of a difference because the hypervisor will ultimately decide whether the VM executes on one or two physical sockets. However, specifying that the dual-CPU VM really has two cores instead of two sockets could make a difference for non-Caché software licenses.


Summary

In this post I outlined how you can compare processors between vendors, servers or models using SPECint benchmark results. Also how to capacity plan and choose processors based on performance and architecture whether virtualized is used or not.

These are deep subjects, and its easy to head of into the weeds…however the same as the other posts, please comment or ask questions if you do want to head off different directions.

EXAMPLE Searching for SPECint_rate2006 results.

The following figure shows selecting the SPECint_rate2006 results.

mo

Use the search screen narrow results.

Note that you can also to dump all records to a ~20MB .csv file for local processing, for example with Excel.

The results of the search show the Dell R730.

mo

mo

Selecting HTML to give the full benchmark result.

mo

You can see the following results for servers with the processors in our example.

Dell PowerEdge R710 with 2.93 GHz: 8 cores, 2 chips, 4 cores/chip, 2 threads/core Xeon 5570: SPECint_rate_base2006 = 251

PowerEdge R730 (Intel Xeon E5-2680 v3, 2.50 GHz) 24 cores, 2 chips, 12 cores/chip, 2 threads/core Xeon E5-2680 v3: SPECint_rate_base2006 = 1030

10
2 5281
Article Mikhail Khomenko · Feb 13, 2017 14m read

This post is dedicated to the task of monitoring a Caché instance using SNMP. Some users of Caché are probably doing it already in some way or another. Monitoring via SNMP has been supported by the standard Caché package for a long time now, but not all the necessary parameters are available “out of the box”. For example, it would be nice to monitor the number of CSP sessions, get detailed information about the use of the license, particular KPI’s of the system being used and such. After reading this article, you will know how to add your parameters to Caché monitoring using SNMP.

14
3 11735
Article Lexi Hayden · Jul 18, 2017 2m read

The newer dynamic SQL classes (%SQL.Statement and %StatementResult) perform better than %ResultSet, but I did not adopt them for some time because I had learned how to use %ResultSet. Finally, I made a cheat sheet, which I find useful when writing new code or rewriting old code. I thought other people might find it useful.

First, here is a somewhat more verbose adaptation of my cheat sheet:

35
4 2473
Article Henry Pereira · Apr 11, 2019 10m read


Hello everyone,

I was first introduced to TDD almost 9 year ago, and I immediately fell in love with it. 
Nowadays it's become very popular but, unfortunately, I see that many companies don't use it. Moreover, many developers don't even know what it is exactly or how to use it, mainly beginners.

Overview

My goal with this article is to show how to use TDD with %UnitTest. I will show my workflow and explain how to use cosFaker, one of my first projects, which I created using Caché and recently uploaded to OpenExchange.

So buckle up and let's go.

What is TDD?

7
10 1647
Article Alexander Koblov · Jul 29, 2016 10m read

In this article we are going to compare $Increment and $Sequence functions.

First of all, a note for readers who have never heard of $Increment. $Increment is a Caché ObjectScript function which performs an atomic operation to increment its argument by 1 and return the resulting value. You can only pass a global or local variable node as a parameter to $Increment, not an arbitrary expression. $Increment is heavily used when assigning sequential IDs. In such cases parameter of $Increment is usually a global node. $Increment guarantees that each process using it gets a unique ID.

for i=1:1:10000 {
     set Id = $Increment(^Person) ; new Id
     set surname = ##class(%PopulateUtils).LastName() ; random last name
     set name = ##class(%PopulateUtils).FirstName()  ; random first name
     set ^Person(Id) = $ListBuild(surname, name)
}

The problem with $Increment is that if many processes are adding rows in parallel, these processes might spend time waiting for their turn to atomically change value of global node that holds the ID — ^Person in the sample above

$Sequence is a new function that was designed to handle this problem. $Sequence is available since Caché 2015.1. Just like $Increment, $Sequence atomically increments value of its parameter. Unlike $Increment, $Sequence will reserve some subsequent counter values for current process and during the next call in the same process it will simply return the next value from the reserved range. $Sequence automatically calculates how many values to reserve. More often process calls $Sequence, more values $Sequence reserves:

USER>kill ^myseq

USER>for i=1:1:15 {write "increment:",$Seq(^myseq)," allocated:",^myseq,! }
increment:1 allocated:1
increment:2 allocated:2
increment:3 allocated:4
increment:4 allocated:4
increment:5 allocated:8
increment:6 allocated:8
increment:7 allocated:8
increment:8 allocated:8
increment:9 allocated:16
increment:10 allocated:16
increment:11 allocated:16
increment:12 allocated:16
increment:13 allocated:16
increment:14 allocated:16
increment:15 allocated:16

When $Sequence(^myseq) returned 9, next 8 values (up to 16) were already reserved for current process. If other process calls $Sequence, it would get value of 17, not 10.

$Sequence is designed for processes that simultaneously increment some global node. Since $Sequence reserve values, IDs might have gaps if process does not use all of the values that were reserved. The main usage of $Sequence is generation of sequential IDs. Compared with $Sequence, $Increment is more generic function.

Let’s compare performance of $Increment and $Sequence:

Class DC.IncSeq.Test 
{

ClassMethod filling()
{
    lock +^P:"S"
    set job = $job
     for i=1:1:200000 {
         set Id = $Increment(^Person)
         set surname = ##class(%PopulateUtils).LastName()
         set name = ##class(%PopulateUtils).FirstName()
         set ^Person(Id) = $ListBuild(job, surname, name)
     }
     lock -^P:"S"
}

ClassMethod run()
{
    kill ^Person
    set z1 = $zhorolog
    for i=1:1:10 {
        job ..filling()
     }
     lock ^P
     set z2 = $zhorolog - z1
     lock
     write "done:",z2,!
}

}

Method run jobs off 10 processes, each inserting 200’000 records into ^Person global. To wait until child processes will finish. method run tries to get exclusive lock on ^P. When child processes finish their job and release shared lock on ^P, run will acquire an exclusive lock on ^P and continue execution. Right after this we record time from $zhorolog system variable and calculate how much time it took to insert these records. My multi-core notebook with slow HDD took 40 seconds (for science, I ran it several times before, so this was 5th run):

USER>do ##class(DC.IncSeq.Test).run()
done:39.198488

It’s interesting to drill down into these 40 seconds. By running ^%SYS.MONLBL we can see that total 100 seconds were spent getting ID. 100 seconds / 10 processes = each process spent 10 seconds to acquire new ID, 1.7 second to get first name and last name, and 28.5 seconds to write data to data global.

First column in %SYS.MONLBL report below is line number, second is how many times this line was executed, and third is how many seconds it took to execute this line.

 ; ** Source for Method 'filling' **
1            10    .001143    lock +^P:"S"
2            10    .000055    set job = $JOB
3            10    .000118     for i=1:1:200000 {
4       1998499 100.356554         set Id = $Increment(^Person)
5       1993866  10.409804         set surname = ##class(%PopulateUtils).LastName()
6       1990461   6.347832         set name = ##class(%PopulateUtils).FirstName()
7       1999762  285.54603         set ^Person(Id) = $ListBuild(job, surname, name)
8       1999825   3.393706     }
9            10    .000259     lock -^P:"S"
 ; ** End of source for Method 'filling' **
 ;
 ; ** Source for Method 'run' **
1             1    .005503    kill ^Person
2             1    .000002    set z1 = $zhorolog
3             1    .000002    for i=1:1:10 {
4            10    .201327        job ..filling()
5             0          0     }
6             1  43.472692     lock ^P
7             1     .00003     set z2 = $zhorolog - z1
8             1     .00001     lock
9             1    .000053     write "done:",z2,!
 ; ** End of source for Method 'run' **

Total time (43.47 seconds) is 4 seconds more than during previous run because of profiling.

Let’s replace one thing in our test code, in filling method. We will change $Increment(^Person) to $Sequence(^Person) and run test again:

USER>do ##class(DC.IncSeq.Test).run()
done:5.135189

This result is surprising. Ok, $Sequence decreased time to get ID, but where did 28.5 seconds to store data in global go? Let’s check ^%SYS.MONLBL:

 ; ** Source for Method 'filling' **
1            10    .001181    lock +^P:"S"
2            10    .000026    set job = $JOB
3            10    .000087     for i=1:1:200000 {
4       1802473   1.996279         set Id = $Sequence(^Person)
5       1784910   4.429576         set surname = ##class(%PopulateUtils).LastName()
6       1853508   3.829051         set name = ##class(%PopulateUtils).FirstName()
7       1838752  32.281624         set ^Person(Id) = $ListBuild(job, surname, name)
8       1951569     1.0243     }
9            10    .000219     lock -^P:"S"
 ; ** End of source for Method 'filling' **
 ;
 ; ** Source for Method 'run' **
1             1    .006514    kill ^Person
2             1    .000002    set z1 = $zhorolog
3             1    .000002    for i=1:1:10 {
4            10    .385055        job ..filling()
5             0          0     }
6             1   6.558119     lock ^P
7             1    .000011     set z2 = $zhorolog - z1
8             1    .000008     lock
9             1    .000025     write "done:",z2,!
 ; ** End of source for Method 'run' **

Now, each process spends 0.2 seconds instead of 10 seconds for ID acquisition. What is not clear is why storing data takes only 3.23 seconds per process? The reason is globals nodes are stored in data blocks, and usually each block has size of 8192 bytes. Before changing global node value (like set ^Person(Id) = …), process locks the whole block. If several processes are trying to change data inside of the same block at the same time, only one process will be allowed to change the block and others will have to wait for it to finish.

Let’s look at global created using $Increment to generate new IDs. Sequential records would almost never have the same process ID (remember -- we stored process ID as the first element of data list):

1:    ^Person(100000)    =    $lb("12950","Kelvin","Lydia")
2:     ^Person(100001)    =    $lb("12943","Umansky","Agnes")
3:     ^Person(100002)    =    $lb("12945","Frost","Natasha")
4:     ^Person(100003)    =    $lb("12942","Loveluck","Terry")
5:     ^Person(100004)    =    $lb("12951","Russell","Debra")
6:     ^Person(100005)    =    $lb("12947","Wells","Chad")
7:     ^Person(100006)    =    $lb("12946","Geoffrion","Susan")
8:     ^Person(100007)    =    $lb("12945","Lennon","Roberta")
9:     ^Person(100008)    =    $lb("12944","Beatty","Mark")
10:     ^Person(100009)    =    $lb("12946","Kovalev","Nataliya")
11:     ^Person(100010)    =    $lb("12947","Klingman","Olga")
12:     ^Person(100011)    =    $lb("12942","Schultz","Alice")
13:     ^Person(100012)    =    $lb("12949","Young","Filomena")
14:     ^Person(100013)    =    $lb("12947","Klausner","James")
15:     ^Person(100014)    =    $lb("12945","Ximines","Christine")
16:     ^Person(100015)    =    $lb("12948","Quine","Mary")
17:     ^Person(100016)    =    $lb("12948","Rogers","Sally")
18:     ^Person(100017)    =    $lb("12950","Ueckert","Thelma")
19:     ^Person(100018)    =    $lb("12944","Xander","Kim")
20:     ^Person(100019)    =    $lb("12948","Ubertini","Juanita")

Concurrent processes were trying to write data into the same block and were spending more time waiting than actually changing data. Using $Sequence, IDs are generated in chunks, so different processes would most likely use different blocks:

1:     ^Person(100000)    =    $lb("12963","Yezek","Amanda")
// 351 records with process number 12963
353:     ^Person(100352)    =    $lb("12963","Young","Lola")
354:     ^Person(100353)    =    $lb("12967","Roentgen","Barb")

If this sample looks like something you are doing in your projects, consider using $Sequence instead of $Increment. Of course, consult with documentation before replacing every occurrence of $Increment with $Sequence.

And sure, don’t believe tests provided here -- double check this yourself.

Starting with Caché 2015.2, you can configure tables to use $Sequence instead of $Increment. There is a system function $system.Sequence.SetDDLUseSequence for that, and the same option is available from SQL Settings in Management Portal.

Also, there is new storage parameter in class definition -- IDFunction, which is set to “increment” by default, that means that $Increment is used for Id generation. You can change it to “sequence” (Inspector > Storage > Default > IDFunction).

Bonus

Another quick test I conducted on my notebook: it’s a small ECP configuration with DB Server located on host operation system and Application Server on guest VM on the same notebook. I mapped ^Person to remote database. It is a basic test, so I don’t want to make generalizations based on it. There are things to consider when using $Increment and ECP. Having said that, here are the results:

With $Increment:

USER>do ##class(DC.IncSeq.Test).run()
done:163.781288

^%SYS.MONLBL:

 ; ** Source for Method 'filling' **
1            10    .000503         --     lock +^P:"S"
2            10    .000016    set job = $job
3            10    .000044    for i=1:1:200000 {
4       1843745 1546.57015        set Id = $Increment(^Person)
5       1880231   6.818051        set surname = ##class(%PopulateUtils).LastName()
6       1944594   3.520858        set name = ##class(%PopulateUtils).FirstName()
7       1816896  16.576452        set ^Person(Id) = $ListBuild(job, surname, name)
8       1933736    .895912    }
9            10    .000279    lock -^P:"S"
 ; ** End of source for Method 'filling' **
 ;
 ; ** Source for Method 'run' **
1             1    .000045    kill ^Person
2             1    .000001    set z1 = $zhorolog
3             1    .000007    for i=1:1:10 {
4            10    .059868        job ..filling()
5             0          0    }
6             1 170.342459    lock ^P
7             1    .000005    set z2 = $zhorolog - z1
8             1    .000013    lock
9             1    .000018    write "done:",z2,!
 ; ** End of source for Method 'run' **

$Sequence:

USER>do ##class(DC.IncSeq.Test).run()
done:13.826716

^%SYS.MONLBL

 ; ** Source for Method 'filling' **
1            10    .000434     lock +^P:"S"
2            10    .000014    set job = $job
3            10    .000033    for i=1:1:200000 {
4       1838247  98.491738        set Id = $Sequence(^Person)
5       1712000   3.979588        set surname = ##class(%PopulateUtils).LastName()
6       1809643   3.522974        set name = ##class(%PopulateUtils).FirstName()
7       1787612  16.157567        set ^Person(Id) = $ListBuild(job, surname, name)
8       1862728    .825769    }
9            10    .000255    lock -^P:"S"
 ; ** End of source for Method 'filling' **
 ;
 ; ** Source for Method 'run' **
1             1    .000046    kill ^Person
2             1    .000002    set z1 = $zhorolog
3             1    .000004    for i=1:1:10 {
4            10    .037271        job ..filling()
5             0          0    }
6             1  14.620781    lock ^P
7             1    .000005    set z2 = $zhorolog - z1
8             1    .000013    lock
9             1    .000016    write "done:",z2,!
 ; ** End of source for Method 'run' **
11
5 1920
Article Sean Klingensmith · Nov 18, 2016 10m read

As a developer, you have probably spent at least some time writing repetetive code. You may have even found yourself wishing you could generate the code programmatically. If this sounds familiar, this article is for you!

We'll start with an example. Note: the following examples use the %DynamicObject interface, which requires Caché 2016.2 or later. If you are unfamiliar with this class, check out the documentation here: Using JSON in Caché. It's really cool!

##Example

You have a %Persistent class that you use to store data. Now, suppose that you are ingesting some data in JSON format, using the %DynamicObject interface. How do you map the %DynamicObject structure to your class? One solution is to simply write code to copy the values over directly:

Class Test.Generator Extends %Persistent 
{
Property SomeProperty As %String;

Property OtherProperty As %String;

ClassMethod FromDynamicObject(dynobj As %DynamicObject) As Test.Generator
{
	set obj = ..%New()
	set obj.SomeProperty = dynobj.SomeProperty
	set obj.OtherProperty = dynobj.OtherProperty
	quit obj
}
}

However, this will get tedious (not to mention difficult to maintain) if there are many properties, or if you use this pattern for multiple classes. This is where method generators can help! Simply put, when using a method generator, instead of writing the code for a given method, you write some code that the class compiler will run to generate the code for the method. Does this sound confusing? It really isn't. Let us look at an example:

Class Test.Generator Extends %Persistent
{
ClassMethod Test() As %String [ CodeMode = objectgenerator ]
{
	do %code.WriteLine(" write ""This is a method Generator!"",!")
	do %code.WriteLine(" quit ""Done!""")

	quit $$$OK
}
}

We use the parameter CodeMode = objectgenerator to indicate that the current method is a method generator, and not a normal method. What does this method do? In order to debug method generators, it is useful to look at the generated code for the class. In our case, this will be in an INT routine named Test.Generator.1.INT. You can open this in Studio by typing Ctrl+Shift+V, or you can just open the routine from the Studio "Open" dialog, or from Atelier.

In the INT code, you can find the implementation for this method:

zTest() public {
 write "This is a method Generator!",!
 quit "Done!" }

As you can see, the method implementation simply contains the text that is written to the %code object. %code is a special type of stream object (%Stream.MethodGenerator). The code written to this stream can contain any code valid in a MAC routine, including macros, preprocessor directives, and embedded SQL. There are a couple of things to keep in mind when working with method generators:

  • The method signature applies to the target method you are generating. The generator code should always return a Status code indicating either success or an error condition.

  • The code written to %code must be valid ObjectScript (method generators with other language modes are outside the scope of this article). This means, among other things, that lines containing commands must start with whitespace. Note that the two WriteLine() calls in the example begin with a space.

In addition to the %code variable (representing the generated method), the compiler makes the metadata for the current class available in the following variables:

  • %class
  • %method
  • %compiledclass
  • %compiledmethod
  • %parameter

The first four of these variables are instances of %Dictionary.ClassDefinition, %Dictionary.MethodDefinition, %Dictionary.CompiledClass%Dictionary.CompiledMethod, respectively. %parameter is a subscripted array of parameter names and values defined in the class.

The main difference (for our purposes) between %class and %compiledclass is that %class only contains metadata for class members (properties, methods, etc.) defined in the current class. %compiledclass will contain these members, but will also contain metadata for all inherited members. In addition, type information referenced from %class will appear exactly as specified in the class code, whereas types in %compiledclass (and %compiledmethod) will be expanded to the full classname. For instance, %String will be expanded to %Library.String, and class names without a package specified will be expanded to the full Package.Class name. You can see the class reference for these classes for further information.

Using this information, we can build a method generator for our %DynamicObject example:

ClassMethod FromDynamicObject(dynobj As %DynamicObject) As Test.Generator [ CodeMode = objectgenerator ]
{
	do %code.WriteLine(" set obj = ..%New()")
	for i=1:1:%class.Properties.Count() {
		set prop = %class.Properties.GetAt(i)
		do %code.WriteLine(" if dynobj.%IsDefined("""_prop.Name_""") {")
		do %code.WriteLine("   set obj."_prop.Name_" = dynobj."_prop.Name)
		do %code.WriteLine(" }")
	}
	
	do %code.WriteLine(" quit obj")
	quit $$$OK
}

This creates the following code:

zFromDynamicObject(dynobj) public {
 set obj = ..%New()
 if dynobj.%IsDefined("OtherProperty") {
   set obj.OtherProperty = dynobj.OtherProperty
 }
 if dynobj.%IsDefined("SomeProperty") {
   set obj.SomeProperty = dynobj.SomeProperty
 }
 quit obj }

As you can see, this generates code to set each property defined in this class. Our Implementation excludes inherited properties, but we could easily include them by using %compiledclass.Properties instead of %class.Properties. We also added a check to see if the property exists in the %DynamicObject before attempting to set it. This isn't strictly necessary, since referencing a property that does not exists from a %DynamicObject will not result in an error, but it is helpful if any of the properties in the class define a default value. If we didn't perform this check, the default value would always be overwritten by this method.

Method generators can be very powerful when combined with inheritance. We can take the FromDynamicObject() method generator and put it in an abstract class. Now if we want to write a new class that needs to be able to be deserialized from a %DynamicObject, all we need to do is to extend this class to enable this functionality. The class compiler will run the method generator code when compiling each subclass, creating a custom implementation for that class.

Debugging Method Generators

Basic debugging

Using method generators adds a level indirection to your programming. This can cause some problems when trying to debug our generator code. Let's look at an example. Consider the following method:

Method PrintObject() As %Status [ CodeMode = objectgenerator ]
{
	if (%class.Properties.Count()=0)&&($get(%parameter("DISPLAYEMPTY"),0)) {
		do %code.WriteLine(" write ""{}"",!")
	} elseif %class.Properties.Count()=1 {
		set pname = %class.Properties.GetAt(1).Name
		do %code.WriteLine(" write ""{ "_pname_": ""_.."_pname_"_""}"",!")
	} elseif %class.Properties.Count()>1 {
		do %code.WriteLine(" write ""{"",!")
		for i=1:1:%class.Properties.Count() {
			set pname = %class.Properties.GetAt(i).Name
			do %code.WriteLine(" write """_pname_": ""_.."_pname_",!")
		}
		do %code.WriteLine(" write ""}""")
	}
	
	do %code.WriteLine(" quit $$$OK")
	quit $$$OK
}

This is a simple method designed to print the contents of an object. It will output the objects using a different format depending on the number of properties: an object with multiple properties will be printed on multiple lines, while an object with zero or one properties will be printed on one line. Additionally the object introduces a Parameter DISPLAYEMTPY, which will control whether to suppress output for objects with zero properties. However, there is a problem with the code. For a class with zero properties, the object isn't being output correctly:

TEST>set obj=##class(Test.Generator).%New()

TEST>do obj.PrintObject()

TEST>

We expect this to output an empty object "{}", not nothing. To debug this we can look in the INT code to see what is happening. However, upon opening the INT code, you find that there is no definition for zPrintObject()! Don't take my word for it, compile the code and look for yourself. Go on... I'll wait.

OK. Back? What's going on here? Astute readers may have figured out the initial problem: There is a typo in the first clause of the IF statement The default for the DISPLAYEMPTY parameter should be 1 not 0. It should be: $get(%parameter("DISPLAYEMPTY"),1) not $get(%parameter("DISPLAYEMPTY"),0). This explains the behavior. But why wasn't the method in the INT code? It was still executable. We didn't get a <METHOD DOES NOT EXIST> error; the method just didn't do anything. Now that we see the mistake, let's look at what the code would have been if it were in the INT code. Since we failed to satisfy any of the conditions in the if ... elseif ... construct the code would simply be:

zPrintObject() public {
	quit 1 }

Notice that this code doesn't actually do anything; it just returns a literal value. It turns out that the Caché class compiler is pretty clever. In certain situations it can detect that the code for a method doesn't need to be executed, and can optimize away the INT code for the method. This is a great optimization, since dispatching from the kernel to the INT code can involve a fair amount of overhead, especially for simple methods.

Note that this behavior isn't specific to method generators. Try compiling the following method, and looking for it in the INT code:

ClassMethod OptimizationTest() As %Integer
{
	quit 10
}

Looking in the INT code can be very helpful when debugging your method generator code. This will tell you what the generator really produced. However, you have to be careful to realize that there are some cases when the generated code will not appear in the INT code. If this is happening unnexpectedly, there is likely a bug in the generator code that is causing it to fail to generate any meaningful code.

Using a debugger

As we saw, if there is a problem with the generated code, we can see it by looking at the INT code. We can also debug the method normally using ZBREAK or the Studio debugger. You might be wondering if there is a way to debug the method generator code itself. Of course, you can always add "write" statements to the method generator or set debug globals like a caveman. But there has to be a better way, right?

The answer is "Yes", but in order to understand how, we need to get some background on how the class compiler works. Broadly speaking, when the class compiler compiles a class it will first parse the class definition and generate the metadata for the class. It is essentially generating the data for the %class and %compiledclass variables we discussed earlier. Next it generates the INT code for all the methods. During this step, it will create a separate routine to contain the generation code for all the method generators. This routine is named <classname>.G1.INT. It then executes the code in the *.G1 routine to generate the code for the methods, and stores them in the <classname>.1.INT routine with the rest of the class's methods. It can then compile this routine and voila! We have our compiled class! This is of course a gross simplification of a very complex piece of software - but it will do for our purposes.

This *.G1 routine sounds interesting. Let's take a look!

	;Test.Generator3.G1
	;(C)InterSystems, method generator for class Test.Generator3.  Do NOT edit.
	Quit
	;
FromDynamicObject(%class,%code,%method,%compiledclass,%compiledmethod,%parameter) public {
	do %code.WriteLine(" set obj = ..%New()")
	for i=1:1:%class.Properties.Count() {
		set prop = %class.Properties.GetAt(i)
		do %code.WriteLine(" if dynobj.%IsDefined("""_prop.Name_""") {")
		do %code.WriteLine("   set obj."_prop.Name_" = dynobj."_prop.Name)
		do %code.WriteLine(" }")
	}
	do %code.WriteLine(" quit obj")
	quit 1
 Quit 1 }

You may be used to editing the INT code for a class and adding debug code. Normally that's fine, if a little primitive. However, that is not going to work here. In order to execute this code, we need to recompile the class. (It is called by the class compiler, after all.) But recompiling the class will regenerate this routine, wiping out any changes we made. Fortunately we can use ZBreak or the Studio debugger to walk through this code. Since we now know the name of the routine, using ZBreak is pretty straightforward:

TEST>zbreak FromDynamicObject^Test.Generator.G1

TEST>do $system.OBJ.Compile("Test.Generator","ck")

Compilation started on 11/14/2016 17:13:59 with qualifiers 'ck'
Compiling class Test.Generator
FromDynamicObject(%class,%code,%method,%compiledclass,%compiledmethod,%parameter) publ
            ^
ic {
<BREAK>FromDynamicObject^Test.Generator.G1
TEST 21e1>write %class.Name
Test.Generator
TEST 21e1>

Using the Studio Debugger is also simple. You can set a breakpoint in the *.G1.MAC routine, and configure the debug target to invoke $System.OBJ.Compile() on the class:

$System.OBJ.Compile("Test.Generator","ck")

And now you are up and debugging.

Conclusion

This article has been a brief overview of method generators. For further information, please check out the documentation below:

2
3 3506
Article Eduard Lebedyuk · Apr 12, 2019 1m read

This series of articles would cover Python Gateway for InterSystems Data Platforms. Leverage modern AI/ML tools and execute Python code and more from InterSystems IRIS. This project brings you the power of Python right into your InterSystems IRIS environment:

  • Execute arbitrary Python code
  • Seamlessly transfer data from InterSystems IRIS into Python
  • Build intelligent Interoperability business processes with Python Interoperability Adapter
  • Save, examine, modify and restore Python context from InterSystems IRIS

Index

The plan for the series so far (subject to change).

  • Part I: Overview, Landscape and Introduction <-- you're here
  • Part II: Installation and Troubleshooting
  • Part III: Basic functionality
  • Part IV: Interoperability Adapter
  • Part V: Execute function
  • Part VI: Dynamic Gateway
  • Part VII: Proxy Gateway
  • Part VIII: Use cases and ML Toolkit

Overview

Machine learning (ML) - is the study of algorithms and statistical models to effectively perform a specific task without using explicit instructions, relying on patterns and inference instead.

Machine learning algorithms and models are becoming more and more commonplace. There is a variety of reasons for that, but it all comes down to affordability, simplicity and producing actionable results. Is clustering or even neural network modeling a new technology? Of course not, but nowadays you do not need to write hundreds of thousands lines of code to run one and the costs are much more manageable.

Tools are evolving - while we currently do not have completely GUI-based AI/ML tools, but the same progress we saw with many other computer technologies, most notable being BI tools (from writing code to utilizing frameworks to GUI-based configurable solutions) is seen with AI/ML tools. We already passed the point of writing code and are currently utilizing frameworks to configure and calculate the models.

Other improvements, i.e. distributing pre-trained model, where end user should just finish model training on a real-life data also simplify onboarding process. These advances make getting into data science a much easier endeavor for both individuals and companies.

On the other hand nowadays we collect more data about every transaction business makes. With a unified data platform such as InterSystems IRIS all this information can be accessed immediately and used as a fuel for predictive models.

With the other big mover – cloud, running AI/ML workloads becomes easier than ever. Even more important is that we can consume only the resources we require. Moreover, with massive parallelization offered by cloud platforms we can save on a time to a working solution.

But what about results? Here it gets a little trickier. There are lots of tools to build a model, and I’ll talk about them later, and it’s not always easy to build a good model, but what comes after? Extracting business value from a model is also a nontrivial endeavor. The root of the problem is the separation of analytical and transactional data flows and data models. When we train the model, we usually do that on a historical data in a warehouse system. But the greatest place for the built model to be is in the heart of transactional processing. What good is the best fraud detection model if we run it once a day? The criminals would be long gone with the money. We need to train the model on a historical data but we also need to apply the model in a real time on the new incoming data so that our business processes can act on predictions the model makes.

MLToolkit

MLToolkit is a comprehensive set of tools, which aims to do exactly that – bring predictive models and transactional environments together, so that the models you build can be easily leveraged right inside your business processes. Titular Python Gateway is a part of MLToolkit and provides integration with a Python language.

Landscape

Before we go further, I would like to describe several tools and libraries for Python, which we would use later.

Tools

  • Python is an interpreted, high-level, general-purpose programming language. The main advantage of the language is a big library of mathematical, ML and AI libraries. Same as ObjectScript it's an object-oriented language but everything is dynamic rather that static. Also, everything is an object. The later articles assume a passing familiarity with the language. If you want to start learning, I recommend starting with documentation.
  • For our later exercises install Python 3.6.7 64 bit.
  • IDE: I use PyCharm, bet there are a lot of them. If you're using Atelier, Eclipse for Python developers is a thing.
  • Notebook: instead of IDE you can write and share your scripts in a Web-based notebook. The most popular one is Jupyter.

Libraries

Here's a (incomplete) list of libraries used for Machine Learning.

  • Numpy is the fundamental package for scientific computing with Python.
  • Pandas is a library providing high-performance, easy-to-use data structures and data analysis tools.
  • Matplotlib is a 2D plotting library which produces figures in a variety of hardcopy formats and interactive environments across platforms.
  • Seaborn is a data visualization library based on matplotlib. It provides a high-level interface for drawing attractive and informative statistical graphics.
  • Sklearn is a machine Learning library.
  • XGBoost is an optimized distributed gradient boosting library designed to be highly efficient, flexible and portable. It implements machine learning algorithms under the Gradient Boosting framework.
  • Gensim is a library for unsupervised topic modeling and natural language processing.
  • Keras is a high-level neural networks API, written in Python and capable of running on top of TensorFlow, CNTK, or Theano.
  • Tensorflow is an end-to-end open source machine learning platform.
  • PyTorch deep learning platform similar to Tensorflow but Python focused.
  • Nyoka produces PMML from Python models.

Summary

AI/ML technologies allow business to be more effective and more adaptable. Moreover, today these technologies are becoming easier to build and deploy. Start investigating AI/ML technologies and how it can help your organization to grow and prosper. There are examples, stories and use cases from almost every industry. Do not miss your chance to use future technologies today.

What's next

In the next part we would install Python Gateway. Don't forget to register for the upcoming webinar (details below)!

Links

Webinar

Do you want to reap the benefits of the advances in the fields of artificial intelligence and machine learning? With InterSystems IRIS and the Machine Learning (ML) Toolkit, it’s easier than ever. Join my colleague Sergey Lukyanchikov and me on Tuesday, April 23rd at 11am EDT for the Machine Learning Toolkit for InterSystems IRIS webinar to find out how InterSystems IRIS can be used as both a standalone development platform and an orchestration platform for AI/ML models that brings together InterSystems IRIS, Python and other external tools.

Date: Tuesday, April 23rd at 11am EDT

Recommended Audience: Developers, Solution Architects, Data Scientists, and Data Engineers.

REGISTER NOW!

11
9 3097
Article Michael Broesdorf · Jul 22, 2016 16m read

1.About this article

Just like Caché pattern matching, Regular Expressions can be used in Caché to identify patterns in text data – only with a much higher expressive power. This article provides a brief introduction into Regular Expressions and what you can do with it in Caché. The information provided herein is based on various sources, most notably the book “Mastering Regular Expressions” by Jeffrey Friedl and of course the Caché online documentation. The article is not intended to discuss all the possibilities and details of regular expressions. Please refer to the information sources listed in chapter 5 if you would like to learn more. If you prefer to read off-line you can also download the PDF version of this article.

11
8 6008
Article Andreas Schneider · Feb 22, 2017 2m read

I' have done some tests with Caché and Apache Zeppelin. I want to share my experince to use both systems together. I'll try to describe all steps that are required to config Zeppelin to connect to Caché.
 

What is  Apache Zeppelin?

For all who think: What the heck is Apache Zeppelin?, here some details what the project site (http://zeppelin.apache.org) says:

6
0 1472
Article Niyaz Khafizov · Jul 27, 2018 4m read

Hi all. Today we are going to upload a ML model into IRIS Manager and test it.

Note: I have done the following on Ubuntu 18.04, Apache Zeppelin 0.8.0, Python 3.6.5.

Introduction

These days many available different tools for Data Mining enable you to develop predictive models and analyze the data you have with unprecedented ease. InterSystems IRIS Data Platform provide a stable foundation for your big data and fast data applications, providing interoperability with modern DataMining tools. 

2
2 1494
Article David E Nelson · Apr 26, 2019 13m read

The last time that I created a playground for experimenting with machine learning using Apache Spark and an InterSystems data platform,  see Machine Learning with Spark and Caché, I installed and configured everything directly on my laptop: Caché, Python, Apache Spark, Java, some Hadoop libraries, to name a few. It required some effort, but eventually it worked. Paradise. But, I worried. Would I ever be able to reproduce all those steps? Maybe. Would it be possible for a random Windows or Java update to wreck the whole thing in an instant? Almost certainly.

3
7 1070
Article Kyle Baxter · Sep 9, 2016 5m read

Have some free text fields in your application that you wish you could search efficiently?  Tried using some methods before but found out that they just cannot match the performance needs of your customers?  Do I have one weird trick that will solve all your problems?  Don’t you already know!?  All I do is bring great solutions to your performance pitfalls!

As usual, if you want the TL;DR (too long; didn’t read) version, skip to the end.  Just know you are hurting my feelings.

11
2 2784
Article Eduard Lebedyuk · Feb 20, 2018 1m read

I needed to know programmatically if last ran failed or not.

After some exploring, here's the code:

ClassMethod isLastTestOk() As %Boolean{  set in = ##class(%UnitTest.Result.TestInstance).%OpenId(^UnitTest.Result)  for i=1:1:in.TestSuites.Count() {    #dim suite As %UnitTest.Result.TestSuite    set suite = in.TestSuites.GetAt(i)    return:suite.Status=0 $$$NO  }  quit $$$YES}
4
1 665
Article Murray Oldfield · Mar 15, 2018 14m read

InterSystems Data Platform includes utilities and tools for system monitoring and alerting, however System Administrators new to solutions built on the InterSystems Data Platform (a.k.a Caché) need to know where to start and what to configure.

This guide shows the path to a minimum monitoring and alerting solution using references from online documentation and developer community posts to show you how to enable and configure the following;

  1. Caché Monitor: Scans the console log and sends emails alerts.

  2. System Monitor: Monitors system status and resources, generating notifications (alerts and warnings) based on fixed parameters and also tracks overall system health.

  3. Health Monitor: Samples key system and user-defined metrics and compares them to user-configurable parameters and established normal values, generating notifications when samples exceed applicable or learned thresholds.

  4. History Monitor: Maintains a historical database of performance and system usage metrics.

  5. pButtons: Operating system and Caché metrics collection scheduled daily.

Remember this guide is a minimum configuration, the included tools are flexible and extensible so more functionality is available when needed. This guide skips through the documentation to get you up and going. You will need to dive deeper into the documentation to get the most out of the monitoring tools, in the meantime, think of this as a set of cheat sheets to get up and running.


1. Caché Monitor

The console log (install-directory/mgr/cconsole.log) must be monitored, either through third party tools that scan the log file or as we do here using the included Caché Monitor utility to send alerts to an email address.

The console log is the central repository for other monitoring tools including Caché System Monitor and Caché Health Monitor to write their alerts and notifications.

At a minimum configure Caché Monitor to send alerts to an email.

Caché Monitor is managed with the ^MONMGR utility.

Caché Monitor Basic set up

Caché Monitor scans the console log and generates notifications based on configurable message severity level. Notifications are sent by email to a list of recipients you configure. The default scan period is every 10 seconds, but this can be changed.

Tip: Configure Caché Monitor alert severity level to 1 (warning, severe and fatal entries). If you find you are getting too many alerts you can drop back to alert level 2 (severe and fatal entries).

When there is a series of entries within 60 seconds from a given process a notification is generated for the first entry only then suspended for one hour. So you must investigate problems when they arise. Because there are no new messages does not mean an event has passed. The exception to this rule is console log entries listed in Caché Monitor Errors and Traps which generate notifications for all entries.

See online documentation for ^MONMGR for full configuration details.

Caché Monitor Cheat sheet

There is not much to do to enable Caché Monitor. Ensure the Monitor is started, then set the email options.

%SYS>d ^MONMGR
1) Start/Stop/Update MONITOR
2) Manage MONITOR Options
3) Exit
Option? **1**

1) Update MONITOR
2) Halt MONITOR
3) Start MONITOR
4) Reset Alerts
5) Exit
Option? **3**

Starting MONITOR... MONITOR started
1) Update MONITOR
2) Halt MONITOR
3) Start MONITOR
4) Reset Alerts
5) Exit
Option? **<return>**

Set the alert severity level.

1) Start/Stop/Update MONITOR
2) Manage MONITOR Options
3) Exit
Option? **2**

1) Set Monitor Interval
2) Set Alert Level
3) Manage Email Options
4) Exit
Option? **2**

Alert on Severity (1=warning,2=severe,3=fatal)? 2 => **1**

Set email options, you may have to talk to your IT department to get the address of your email server. Any valid email address should work.

1) Set Monitor Interval
2) Set Alert Level
3) Manage Email Options
4) Exit
Option? **3**

1) Enable/Disable Email
2) Set Sender
3) Set Server
4) Manage Recipients
5) Set Authentication
6) Test Email
7) Exit
Option?

Make sure you test the email after set up (option 6).

Caché Monitor Example

The Caché System Monitor generates a severity 2 entry for high CPU utilisation which is sent to cconsole.log:

03/07/18-11:44:50:578 (4410) 2 [SYSTEM MONITOR] CPUusage Alert: CPUusage = 92, 95, 98 (Max value is 85).

An email is also sent to Caché Monitor email recipients with the same message as the console.log and the subject line:

[CACHE SEVERE ERROR yourserver.name.com:instancename] [SYSTEM MONITOR] CPUusage Alert: CPUusage = 92, 95, 98 (Max value is 85).

Caché Monitor More Tips

There is also another article on the developer community with a comment by Aric West with the tip to embed more information in the sender email, for example rather than just a valid email setting sender or recipient to: "Some Name" <valid@emailAddress.com>


Caché System Monitor Tools

Caché System Monitor is the umbrella for a collection of monitoring tools and is configured through the ^%SYSMONMGR utility. As mentioned in the introduction for a minimum monitoring solution we will configure;

  • System Monitor
  • Health Monitor
  • History Monitor

As a sidebar, yes, the System Monitor name is annoyingly overloaded with Caché System Monitor it’s parent name, .

Caché System Monitor and Health Monitor notifications and alerts are sent to the console log allowing Caché Monitor (set up in the previous section) to generate email messages when the occur.

All the deep detail on Caché System Monitor is in the online documentation.


Warning Note: You also will see Application Monitor in the ^%SYSMONMGR menu. Application Monitor will not be configured in this guide. The tools and utilities shown in this guide have negligible impact on system performance, however Application Monitor does have some classes that are an exception to this rule. For more details see documentation for ^PERFMON utility. If you use Application Monitor you must test on non-production systems first as there can be a significant performance impacts running ^PERFMON for any length of time.


2. System Monitor

From the documentation: “System Monitor samples important system status and resource usage indicators, such as the status of ECP connections and the percentage of the lock table in use, and generates notifications (alerts, warnings, and “status OK” messages) based on fixed statuses and thresholds.”

There is a list of System Monitor Status and Resource Metrics in the documentation. For example: Journal Space (Available space in the journal directory):

  • less than 250 MB = warning
  • less than 50 MB = alert
  • greater than 250 MB after warning/alert = OK

System Monitor Basic Set Up

System Monitor alerts and warnings are written to the console log, so ensure that Caché Monitor is set up to send email alerts (previous section).

System Monitor is managed using the ^%SYSMONMGR utility. By default, the System Monitor is always running when the instance is running; it can be stopped using ^%SYSMONMGR but will start automatically again when the instance next starts.

By default the System Monitor has the following settings, which can be changed:

  • Gets sensor metrics every 30 seconds.
  • Writes only alerts, warnings and messages to the System Monitor log.

System Monitor also maintains a single overall system health state which can be queried or is available when you run commands such as ccontrol list:

  • Green (OK)
  • Yellow (warning)
  • Red (alert)

System Monitor Cheat Sheet

Nothing really to do for a minimal monitoring solution as it is always running when the instance is running.


3. Health Monitor

From the documentation: “Caché Health Monitor monitors a running Caché instance by sampling the values of a broad set of key metrics during specific periods and comparing them to configured parameters for the metric and established normal values for those periods; if sampled values are too high, Health Monitor generates an alert or warning. For example, if CPU usage values sampled by Health Monitor at 10:15 AM on a Monday are too high based on the configured maximum value for CPU usage or normal CPU usage samples taken during the Monday 9:00 AM to 11:30 AM period, Health Monitor generates a notification.”

Health Monitor samples 41 system sensors, the list and defaults are in the documentation.

Health Monitor alerts (severity 2) and warnings (severity 1) are written to the console log. Health Monitor generates:

  • An alert if three consecutive readings of a sensor during a period are greater than the sensor maximum value.
  • A warning if five consecutive readings of a sensor during a period are greater than the sensor warning value.

An alert will be generated immediately for a sensor that has an entry set for maximum or warning value, even when Health Monitor itself is not enabled. For example CPU has a configured maximum of 85 and warning value of 75, so when there have been 5 consecutive CPU utilisation measurements over 75% the following notification is sent to the console log;

1 [SYSTEM MONITOR] CPUusage Warning: CPUusage = 83 ( Warnvalue is 75).

Other sensors require metrics to be collected for long enough to create a chart. A chart is needed to evaluate the mean value for a metric and therefore the standard deviation (sigma) so that alerts can be sent when values fall out of normal range. Metrics are collected within a period. There are 63 standard periods, an example of a period is Monday 9:00 AM to 11:30 AM. Periods may be changed.

Health Monitor Basic Set Up

Health Monitor does not start automatically, to enable this use settings in ^%SYSMONMGR.

By default Health Monitor waits 10 minutes after Caché startup to allow the system to reach normal operation, this can be changed if needed.

Caché Health Monitor Sensor Objects ship with default values. For example, as above, defaults for CPUPct (System CPU usage %) is: base 50, Maximum 90, Warning 80.

You might be more conservative and want to change these values, using ^%SYSMONMGR you can change the values, for example; Maximum 85, Warning 70. Now when the CPU is being thrashed at 99% we see;

2 [SYSTEM MONITOR] CPUusage Alert: CPUusage = 99, 99, 99 (Max value is 85).

Health Monitor cheat sheet

The cheat sheet is quite long, it appears after the Summary.


4. History Monitor

David Loveluck has a great post on community. Follow the instructions in that post to start History Monitor and start collecting and reviewing metrics.


5. pButtons

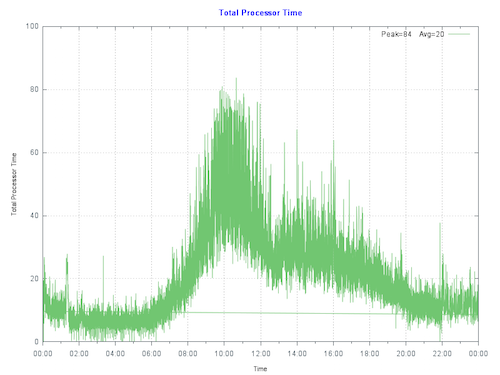
The pButtons utility generates a readable HTML performance report with operating system and Caché metrics from log files it creates. Performance metrics output by pButtons can be extracted, charted and reviewed. For example, a chart of CPU utilisation or Caché database access across the day.

Running a daily 24 hour pButtons collection is a simple but vital way to collect metrics for troubleshooting. pButtons is also very useful for trend analysis. The following Community articles have details of pButtons and instructions for scheduling it to run daily: InterSystems Data Platforms and performance – Part 1

As noted in the article a 30 second collection interval is fine for trend analysis and 24 hour reporting.

There are also instructions for ensuring you have the most up to date version of pButtons, even if you are not running the latest version of Caché: InterSystems Data Platforms and performance – how to update pButtons.

Although pButtons is primarily a support tool, you can gain valuable insights of your systems usage by quickly charting and graphing collected metrics: Yape - Yet another pButtons extractor (and automatically create charts)


Summary

This post has just scratched the surface of the options for monitoring, for example the Health Monitor will work with defaults, but over time you will want to explore the options to customise to your application profile.

Where to next?

As we saw System Monitor and Health Monitor utilities we configured send alerts to cconsole.log as a central reporting location. We used Caché Monitor to surface those alerts to email. There are third party tools that scrape logs and consume unstructured log data that you may be using in you organisation already, and there is no reason you could not use them instead.

Many customers I see today are virtualised on VMware. If you are using vSphere consider using Log Insight for monitoring the console log. At the date of writing this post (March 2018) for each instance of vCenter Server 6.0 you own you are entitled to a free 25 OSI license of vRealize Log Insight for vCenter. Log insight is a tool for reading unstructured data and is used for log management & analytics — for example you can use it with cconsole.log — If this interests you contact VMware for more information. In the meantime I am planning a future post to show Log Insight working with cconsole.log.


If your collecting metrics you still have to look at them and know what they mean, I will keep writing posts to show how to interpret the information presented, especially performance metrics.


Application Performance Monitoring

David Loveluck has a series of posts on the community on Application Performance Monitoring, search for APM on community, or start here.


Appendix: Health Monitor Cheat Sheet

This cheat sheet shows the process to start the Health Monitor we looked at in section 3 and walks through editing a sensor threshold values.

First let us start the Health Monitor.

%SYS>**d ^%SYSMONMGR**

1) Start/Stop System Monitor
2) Set System Monitor Options
3) Configure System Monitor Classes
4) View System Monitor State
5) Manage Application Monitor
6) Manage Health Monitor
7) View System Data
8) Exit
Option? **6**

1) Enable/Disable Health Monitor
2) View Alerts Records
3) Configure Health Monitor Classes
4) Set Health Monitor Options
5) Exit
Option? **1**

Enable Health Monitor? No => **yes**
Health Monitor is Enabled. Stop and restart System Monitor to run Health Monitor

As we can see from the message navigate back to the first menu or start ^%SYSMONMGR again to to stop and start System Monitor to complete the process.

%SYS>**d ^%SYSMONMGR**

1) Start/Stop System Monitor
2) Set System Monitor Options
etc...

We will go ahead here with an example of editing the CPUPct threshold.

%SYS>**d ^%SYSMONMGR**

1) Start/Stop System Monitor
2) Set System Monitor Options
3) Configure System Monitor Classes
4) View System Monitor State
5) Manage Application Monitor
6) Manage Health Monitor
7) View System Data
8) Exit
Option? **6**

1) Enable/Disable Health Monitor
2) View Alerts Records
3) Configure Health Monitor Classes
4) Set Health Monitor Options
5) Exit
Option? **3**

1) Activate/Deactivate Rules
2) Configure Periods
3) Configure Charts
4) Edit Sensor Objects
5) Reset Defaults
6) Exit
Option? **4**

Lets have a look at all the sensors first;

1) List Sensor Objects
2) Edit Sensor Object
3) Exit
Option? **1**

Sensor                        Base      Max       Max M     Warn      Warn M
--                        ----      ---       -----     ----      ------
CPUPct                        50        80        0         70        0
CPUusage                      50        85        0         75        0
CSPActivity                   100       0         2         0         1.6
:
: <Big list of sensors goes here>
:
WDWIJTime                     60        0         2         0         1.6
WDWriteSize                   1024      0         2         0         1.6

1) List Sensor Objects
2) Edit Sensor Object
3) Exit
Option? **2**
Cannot configure while System Monitor is running.

1) List Sensor Objects
2) Edit Sensor Object
3) Exit

D’oh, we need to go back and disable Health Monitor and System Monitor first.

1) Enable/Disable Health Monitor
2) View Alerts Records
3) Configure Health Monitor Classes
4) Set Health Monitor Options
5) Exit
Option? **1**

Disable Health Monitor? No => **yes**
Health Monitor is Disabled. Stop and restart System Monitor to halt Health Monitor

1) Enable/Disable Health Monitor
2) View Alerts Records
3) Configure Health Monitor Classes
4) Set Health Monitor Options
5) Exit
Option?**<return>**

1) Start/Stop System Monitor
2) Set System Monitor Options
3) Configure System Monitor Classes
4) View System Monitor State
5) Manage Application Monitor
6) Manage Health Monitor
7) View System Data
8) Exit
Option? **1**

1) Start System Monitor
2) Stop System Monitor
3) Exit
Option? **2**

Stopping System Monitor... System Monitor stopped

OK, Health Monitor and System Monitor are stopped. Now navigate back to the Health Monitor and edit a sensor object.

1) Start System Monitor
2) Stop System Monitor
3) Exit
Option?**<return>**

1) Start/Stop System Monitor
2) Set System Monitor Options
3) Configure System Monitor Classes
4) View System Monitor State
5) Manage Application Monitor
6) Manage Health Monitor
7) View System Data
8) Exit
Option? **6**

1) Enable/Disable Health Monitor
2) View Alerts Records
3) Configure Health Monitor Classes
4) Set Health Monitor Options
5) Exit
Option? **3**

1) Activate/Deactivate Rules
2) Configure Periods
3) Configure Charts
4) Edit Sensor Objects
5) Reset Defaults
6) Exit
Option? **4**

1) List Sensor Objects
2) Edit Sensor Object
3) Exit
Option? **2**

Enter the sensor name if you know it, else “?” for a list. Sensor? ?

 Num  Sensor                         Threshold
  1)  CPUPct
  2)  CPUusage
:
: <Big list of sensors goes here>
:
 46)  WDWIJTime
 47)  WDWriteSize

Sensor? **1** CPUPct
Base? 50 =>**<return>**
Enter either an Alert Value or a Multiplier
Alert Value? 80 => **85**
Setting Max Multiplier and Warn Multiplier to 0. Enter a Warn Value
Warn Value? 70 => **75**
Sensor object CPUPct updated.
Base           50
MaxMult        0
AlertValue     85
WarnMult       0
WarnValue      75

1) List Sensor Objects
2) Edit Sensor Object
3) Exit

Now back out and enable Health Monitor and start System Monitor.

Option?**<return>**

1) Activate/Deactivate Rules
2) Configure Periods
3) Configure Charts
4) Edit Sensor Objects
5) Reset Defaults
6) Exit
Option?**<return>**

1) Enable/Disable Health Monitor
2) View Alerts Records
3) Configure Health Monitor Classes
4) Set Health Monitor Options
5) Exit
Option? **1**

Enable Health Monitor? No => **yes**
Health Monitor is Enabled. Stop and restart System Monitor to run Health Monitor

1) Enable/Disable Health Monitor
2) View Alerts Records
3) Configure Health Monitor Classes
4) Set Health Monitor Options
5) Exit
Option?**<return>**

1) Start/Stop System Monitor
2) Set System Monitor Options
3) Configure System Monitor Classes
4) View System Monitor State
5) Manage Application Monitor
6) Manage Health Monitor
7) View System Data
8) Exit
Option? **1**

1) Start System Monitor
2) Stop System Monitor
3) Exit
Option? **1**

Starting System Monitor... System Monitor started

OK, you are good to go!


1
8 2383
Article Eduard Lebedyuk · Mar 7, 2018 7m read

In this series of articles, I'd like to present and discuss several possible approaches toward software development with InterSystems technologies and GitLab. I will cover such topics as:

  • Git 101
  • Git flow (development process)
  • GitLab installation
  • GitLab Workflow
  • Continuous Delivery
  • GitLab installation and configuration
  • GitLab CI/CD

In the previous article, we covered Git basics, why a high-level understanding of Git concepts is important for modern software development, and how Git can be used to develop software. Still, our focus was on the implementation part of software development, but this part presents:

  • GitLab Workflow - a complete software life cycle process - from idea to user feedback
  • Continuous Delivery - software engineering approach in which teams produce software in short cycles, ensuring that the software can be reliably released at any time. It aims at building, testing, and releasing software faster and more frequently.
1
3 3394
Article Kurro Lopez · Apr 26, 2017 2m read

Hi,

This is a quick tutorial how to install and use TFS in Atelier. It is based on my self experience and some tricks that I 've noted.

If you are used to using visual studio maybe you feel that is a bit slow and heavy, but you have the same TFS panel as you have in Visual Studio, so don't need any special "training" to use it smiley

It's important don't store the file .buildpath because it has the server definition that you are working in a team, each one have the personal configuration, so the name of the server could be different.

To prevent it, create a file called .tfignore with this content

3
2 1408
Article Steve Pisani · Jun 6, 2016 7m read

This is a posting about a particular feature of Caché which I find useful but is probably not well known or used. I am referring to the feature of Language Extensions.

This feature allows you to extend the commands, special variables and functions available in Caché Object Script with commands, special variables and functions of your own. This functionality also applies to other languages the Caché supports at the server, including Caché Basic and Multivalue Basic.  


Why would I need or want to add new commands ?

5
4 1511
Article Sascha Kisser · Oct 24, 2016 4m read

The goal of this “DeepSee Troubleshooting Guide” is to help you track down and fix problems in your DeepSee project.

If the problem can’t be fixed by following the guidelines, you will at least have enough information to submit a WRC issue with DeepSee Support and provide all the evidence to us, so we can continue the investigation together and resolve it faster!

Please NOTE: If you are unfamiliar with the consequences of a given action or command, please don’t run it as it might have an effect on your production system.  In this case contact DeepSee Support for further assistance. 

16
1 2818
Article Eduard Lebedyuk · Mar 1, 2018 6m read

Everybody has a testing environment.

Some people are lucky enough to have a totally separate environment to run production in.

-- Unknown

.

In this series of articles, I'd like to present and discuss several possible approaches toward software development with InterSystems technologies and GitLab. I will cover such topics as:

  • Git 101
  • Git flow (development process)
  • GitLab installation
  • GitLab WorkFlow
  • GitLab CI/CD
  • CI/CD with containers

This first part deals with the cornerstone of modern software development - Git version control system and various Git flows.

1
4 4880
Article Luca Ravazzolo · Jan 31, 2018 3m read

Containers

With the launch of InterSystems IRIS Data Platform, we provide our product even  in a Docker container. But what is a container?

The fundamental container definition is that of a sandbox for a process.  

Containers are software-defined packages that have some similarities to virtual machines (VM) like for example they can be executed. 

Containers provide isolation without a full OS emulation. Containers are therefore much lighter than a VM. 

20
1 2744
Article Mark Bolinsky · Sep 7, 2018 2m read

Continuing on with providing some examples of various storage technologies and their performance profiles, this time we looked at the growing trend of leveraging internal commodity-based server storage, specifically the new HPE Cloudline 3150 Gen10 AMD processor-based single socket servers with two 3.2TB Samsung  PM1725a NVMe drives.  

2
0 1479
Article Mark Bolinsky · Oct 12, 2018 31m read

Google Cloud Platform (GCP) provides a feature rich environment for Infrastructure-as-a-Service (IaaS) as a cloud offering fully capable of supporting all of InterSystems products including the latest InterSystems IRIS Data Platform. Care must be taken, as with any platform or deployment model, to ensure all aspects of an environment are considered such as performance, availability, operations, and management procedures.  Specifics of each of those areas will be covered in this article.

0
3 4538