Window functions in InterSystems IRIS let you perform powerful analytics — like running totals, rankings, and moving averages — directly in SQL.
They operate over a "window" of rows related to the current row, without collapsing results like GROUP BY.
This means you can write cleaner, faster, and more maintainable queries — no loops, no joins, no temp tables.
In this article let's understand the mechanics of window functions by addressing some common data analisys tasks.
Introduction to SQL Window Functions in InterSystems IRIS
SQL window functions are a powerful tool for data analysis.
They allow you to compute aggregates and rankings across rows while preserving individual row visibility.
Whether you're building dashboards, reports, or complex analytics, window functions simplify your logic and boost performance.
Note: I'm not an expert in window functions, but I’d like to share the insights and resources that helped me understand them. Suggestions or corrections are very welcome!
🚀 Why Window Functions Matter
Have you ever written multiple SQL queries, or even procedural loops, just to calculate running totals, ranks, or differences between rows?
Window functions let you do all that in a single SQL query.
They bring powerful analytics directly into SQL — no extra joins, no temporary tables, and no procedural loops.
🧠 What Are Window Functions?
A window function performs a calculation across a set of rows that are somehow related to the current row — this set of rows is called a window.
As depicted in Figure 1, unlike GROUP BY, window functions don’t collapse rows. They allow you to compute aggregates while still keeping each row visible.
 Figure 1 - Differences between Aggregations and Window Functions
The general syntax looks like this:
window_function_name(...) OVER (
  PARTITION BY column_name
  ORDER BY column_name
  ROWS BETWEEN ...
)
Where:
PARTITION BY defines groups of rows (like "per customer" or "per department").ORDER BY defines the order of rows within each partition.ROWS BETWEEN ... defines which subset of rows are visible to the function (the window frame).
⚙️ Why Use Window Functions?
Before window functions, developers often had to:
- Run multiple queries to get intermediate results.
- Use temporary tables or subqueries to merge partial aggregates.
- Write procedural code in ObjectScript to simulate ranking or running totals.
Window functions solve this neatly — one query, no loops, no extra state to manage.
🧩 Example 1 — Running Total Per Customer
Let’s start with a simple example: compute the running total of each customer’s orders over time.
🛠️ Create and Populate Table for the example
CREATE TABLE Orders (
  OrderID INT,
  CustomerID INT,
  OrderDate DATE,
  OrderAmount DECIMAL(10,2)
)

INSERT INTO Orders (OrderID, CustomerID, OrderDate, OrderAmount)
SELECT 1, 101, '2023-01-01', 100.00 UNION
SELECT 2, 101, '2023-01-05', 150.00 UNION
SELECT 3, 102, '2023-01-02', 200.00 UNION
SELECT 4, 101, '2023-01-10', 50.00 UNION
SELECT 5, 102, '2023-01-07', 100.00
❌ Without window functions — multiple queries
SELECT
  o1.CustomerID,
  o1.OrderDate,
  SUM(o2.OrderAmount) AS RunningTotal
FROM Orders o1
JOIN Orders o2
  ON o1.CustomerID = o2.CustomerID
  AND o2.OrderDate <= o1.OrderDate
GROUP BY o1.CustomerID, o1.OrderDate
ORDER BY o1.CustomerID, o1.OrderDate
Result:
| CustomerID | OrderDate | RunningTotal |
|---|
| 101 | 2023-01-01 | 100 |
| 101 | 2023-01-05 | 250 |
| 101 | 2023-01-10 | 300 |
| 102 | 2023-01-02 | 200 |
| 102 | 2023-01-07 | 300 |
This works, but it needs a self-join and a GROUP BY, and becomes expensive for large datasets.
Window functions allow to write a much more clean SQL query.
✅ With window functions — one query
SELECT
  CustomerID,
  OrderDate,
  SUM(OrderAmount) OVER (
    PARTITION BY CustomerID
    ORDER BY OrderDate
  ) AS RunningTotal
FROM Orders
ORDER BY CustomerID, OrderDate
Result:
| CustomerID | OrderDate | RunningTotal |
|---|
| 101 | 2023-01-01 | 100 |
| 101 | 2023-01-05 | 250 |
| 101 | 2023-01-10 | 300 |
| 102 | 2023-01-02 | 200 |
| 102 | 2023-01-07 | 300 |
Let's break down each statement in the window function syntax:
PARTITION BY CustomerID
Ensures that the running total is calculated separately for each customer. Without this, the sum would span across all customers.
ORDER BY OrderDate
Defines the sequence of orders for each customer, so the running total accumulates in chronological order.
SUM(OrderAmount) OVER (...)
This is the window function applied over the partitions. In this case, it computes the sum of OrderAmount for each row, accumulating them, including all previous rows in the same partition (customer) up to that point.
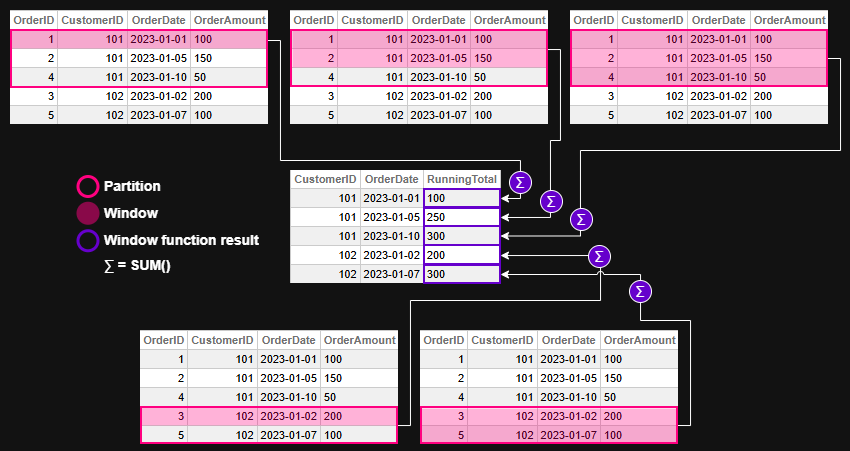 Figure 2 - Window function evaluation for example 1
💡 Example 2 — Ranking Employees by Salary
🛠️ Create and Populate Table for the example
CREATE TABLE Employees (
  EmployeeID INT,
  Department VARCHAR(50),
  Name VARCHAR(100),
  Salary DECIMAL(10,2)
)

INSERT INTO Employees (EmployeeID, Department, Name, Salary)
SELECT 1, 'Sales', 'Alice', 70000 UNION
SELECT 2, 'Sales', 'Bob', 65000 UNION
SELECT 3, 'HR', 'Carol', 60000 UNION
SELECT 4, 'HR', 'Dave', 62000 UNION
SELECT 5, 'Sales', 'Eve', 72000
❌ Without window functions — Dynamic SQL and ObjectScript loops
ClassMethod RankEmployeesBySalary()
{
    Set tSQL = "SELECT Department, EmployeeID, Salary " _
              "FROM Employees ORDER BY Department, Salary DESC"
    Set tRS = ##class(%SQL.Statement).%ExecDirect(, tSQL)

    Set prevDept = ""
    Set rank = 0

    While tRS.%Next() {
        Set dept = tRS.%Get("Department")
        Set emp = tRS.%Get("EmployeeID")
        Set sal = tRS.%Get("Salary")

        If dept '= prevDept {
            Set rank = 1
        } Else {
            Set rank = rank + 1
        }

        Write "Dept: ", dept, " | Emp: ", emp, " | Rank: ", rank, " | Salary: ", sal, !
        Set prevDept = dept
    }
}
Result:
USER>Do ##class(tmp.Teste1).RankEmployeesBySalary()
Dept: HR | Emp: 4 | Rank: 1 | Salary: 62000
Dept: HR | Emp: 3 | Rank: 2 | Salary: 60000
Dept: Sales | Emp: 5 | Rank: 1 | Salary: 72000
Dept: Sales | Emp: 1 | Rank: 2 | Salary: 70000
Dept: Sales | Emp: 2 | Rank: 3 | Salary: 65000
✅ With window functions — one declarative SQL
SELECT
  Department,
  EmployeeID,
  Salary,
  RANK() OVER (
    PARTITION BY Department
    ORDER BY Salary DESC
  ) AS SalaryRank
FROM Employees
ORDER BY Department, SalaryRank
Result:
| Department | EmployeeID | Salary | SalaryRank |
|---|
| HR | 4 | 62000 | 1 |
| HR | 3 | 60000 | 2 |
| Sales | 5 | 72000 | 1 |
| Sales | 1 | 70000 | 2 |
| Sales | 2 | 65000 | 3 |
Let's break down each statement in the window function syntax:
PARTITION BY Department
Ensures that ranking is calculated separately within each department. Without this clause, employees would be ranked across the entire company, ignoring departmental boundaries.
ORDER BY Salary DESC
Sorts employees within each department from highest to lowest salary. This determines the ranking order — higher salaries get lower rank numbers.
RANK() OVER (...)
Applies the ranking function over each department's sorted list. It assigns a rank to each employee based on their salary, with ties receiving the same rank and gaps appearing in the sequence.
 Figure 3 - Window function evaluation for example 2
🧩 Example 3 — Moving Average of Daily Sales
Let’s illustrate how ROWS BETWEEN works with a moving average.
🛠️ Create and Populate Table for the example
CREATE TABLE DailySales (
  SaleDate DATE,
  Amount DECIMAL(10,2)
)

INSERT INTO DailySales (SaleDate, Amount)
SELECT '2023-01-01', 100 UNION
SELECT '2023-01-02', 150 UNION
SELECT '2023-01-03', 200 UNION
SELECT '2023-01-04', 250 UNION
SELECT '2023-01-05', 300
❌ Without window functions — multiple queries and ObjectScript loops
ClassMethod MovingAverageWithoutWindow()
{
    // Query all sales ordered by date
    Set sql = "SELECT SaleDate, Amount FROM DailySales ORDER BY SaleDate"
    Set stmt = ##class(%SQL.Statement).%New()
    Set status = stmt.%Prepare(sql)
    If $$$ISERR(status) {
        Write "SQL Prepare failed: ", status, !
        Quit
    }

    Set rset = stmt.%Execute()

    // Store rows in memory for lookback
    Set rowCount = 0
    While rset.%Next() {
        Set rowCount = rowCount + 1
        Set sales(rowCount, "Date") = rset.%Get("SaleDate")
        Set sales(rowCount, "Amount") = rset.%Get("Amount")
    }

    // Loop through and calculate 3-day moving average
    For i = 1:1:rowCount {
        Set total = 0
        Set count = 0

        For j = i-2:1:i {
            If j >= 1 {
                Set total = total + sales(j, "Amount")
                Set count = count + 1
            }
        }

        Set movingAvg = total / count
        Write "Date: ", sales(i, "Date"), " | Amount: ", sales(i, "Amount"), " | MovingAvg: ", $FN(movingAvg, "", 2), !
    }
}
Result:
USER>Do ##class(tmp.Teste1).MovingAverageWithoutWindow()
Date: 66475 | Amount: 100 | MovingAvg: 100.00
Date: 66476 | Amount: 150 | MovingAvg: 125.00
Date: 66477 | Amount: 200 | MovingAvg: 150.00
Date: 66478 | Amount: 250 | MovingAvg: 200.00
Date: 66479 | Amount: 300 | MovingAvg: 250.00
✅ With window functions — one declarative SQL
SELECT
  SaleDate,
  Amount,
  AVG(Amount) OVER (
    ORDER BY SaleDate
    ROWS BETWEEN 2 PRECEDING AND CURRENT ROW
  ) AS MovingAvg
FROM DailySales
ORDER BY SaleDate
This computes the average of the current day and the two previous days — a rolling 3-day average.
Result:
| SaleDate | Amount | MovingAvg |
|---|
| 2023-01-01 | 100 | 100 |
| 2023-01-02 | 150 | 125 |
| 2023-01-03 | 200 | 150 |
| 2023-01-04 | 250 | 200 |
| 2023-01-05 | 300 | 250 |
Let's break down each statement in the window function syntax:
ORDER BY SaleDate
Defines the chronological order of sales, which is essential for calculating a time-based moving average.
ROWS BETWEEN 2 PRECEDING AND CURRENT ROW
Specifies the window frame: the current row and the two rows before it. This creates a rolling 3-day window for the average calculation.
AVG(Amount) OVER (...)
Applies the window function to compute the average of Amount across the defined frame. For each row, it includes the current day and the two previous days in the calculation.
 Figure 4 - Window function evaluation for example 3
Note that there's no PARTITION BY in this example. This is because the goal is to calculate the moving average across all daily sales, not separately by category, region, or customer.
Using PARTITION BY would split the data into independent groups, causing the moving average to reset within each partition. Since we want a continuous rolling average over time — treating the dataset as a single chronological sequence — we omit PARTITION BY to keep the window unbroken. But off course you can use it if it makes sense for your query requirements.
🏁 Key Takeaway
Window functions let you express what used to require multiple queries or procedural code in a single, elegant SQL statement.
They make your queries more readable, your code more maintainable, and your analytics faster — all without leaving SQL.
🧭 Final Thoughts
Window functions in InterSystems IRIS offer a powerful and elegant way to perform complex analytics directly in SQL. Whether you're calculating running totals, assigning ranks, or computing moving averages, these functions simplify your logic and improve performance — all while keeping your queries readable and maintainable.
By embracing window functions, you unlock a deeper level of insight from your data without resorting to procedural code or convoluted joins. They’re not just a convenience — they’re a leap forward in how we think about SQL analytics.
You can checkout more details and more window function in the Window Functions reference in IRIS documentation.
This article was written with the help of AI tools to clarify concepts and improve readability.
.png)

.png)
.png)
.png)
.png)
.png)
.png)
.png)