Hey Developers,
We bring you good tidings!
You have a great opportunity to promote your business with InterSystems! This is exclusively for Global Masters Advocacy Hub Advocates.

Be first to redeem our new prizes! Please welcome:
This topic unites publications, which describe business ideas and approaches, success stories, architectures, and demos of solutions you can create, build, and implement with InterSystems products: InterSystems IRIS, InterSystems IRIS for Health, HealthShare, Caché, and Ensemble.
Hey Developers,
We bring you good tidings!
You have a great opportunity to promote your business with InterSystems! This is exclusively for Global Masters Advocacy Hub Advocates.
Be first to redeem our new prizes! Please welcome:
I would like to learn about the binary and document reference FHIR Resources. For the PDF data stored in those resources. But I think Binary Resource for the Document PDF stored in FHIR, so this resource is best for it. So sometimes Large PDF 15-page (~35md) data converts into base64 then data length is ~50 lac charecters length of base64binary data. this data store in Binary Resource on data field https://www.hl7.org/fhir/R4/binary.html follow this url this resource used in my case. so it's support the 50 lac charecter of the base64 length? This resource can be Insert into IRIS?
The healthcare technology market is in strong evolution. Gartner's wave chart for healthcare technologies demonstrates what these technologies are, very well reflected by healthcare.digital. I call this HealthTech See:
These technologies can use InterSystems technologies (ISC Health Tech), see:
Consent Management uses InterSystems Healthshare Stack to do MPI and consent management, see:
I try the Large data Save in FHIR server in Binary Resource but it's failed
Methed: Post , URL: fhirservers/fhir/r4/Binary
I hit the API but the record not save and same API but base64 data length is 3 lac than it's save without faile.
I pass data on this formet
{
"resourceType" : "Binary",
// from Resource: id, meta, implicitRules, and language
"contentType" : "<code>", // R! MimeType of the binary content
"securityContext" : { Reference(Any) }, // Identifies another resource to use as proxy when enforcing access control
"data" : "<base64Binary>" // The actual content
}
For those that use IRIS for Health, HealthShare, and or Health Connect...
As Health Applications are moving to the Cloud, how have you handled communication from the Application to your instances via HTTPS?
Trying to figure out the best path on designing the proper workflow to allow these messages to be allowed to be eventually sent to our EMR to post to the patient chart.
We are very wary of opening a connection from the internet to our instance of Health Connect.
Thanks
In the previous article we have reviewed how to install our EMPI in standalone, so we are ready to start the basic configuration of our EMPI.
First of all we have to do an initial basic configuration, we can access to the configuration from the Configuration menu of our Registry.
Selecting that option will allow to us to edit the basic configuration table of the Registry:
In this menu we have to add the following parameters and update the value of one of them:
InterSystems has been at the forefront of database technology since its inception, pioneering innovations that consistently outperform competitors like Oracle, IBM, and Microsoft. By focusing on an efficient kernel design and embracing a no-compromise approach to data performance, InterSystems has carved out a niche in mission-critical applications, ensuring reliability, speed, and scalability.
A History of Technical Excellence
Hi Community,
There is a new PDF Resource published on our official site depicting key features and a comparison of InterSystems healthcare interoperability products: Health Connect and IRIS For Health.
>> https://www.intersystems.com/health-data-integration-chart.pdf
I think this could be useful for the Community.
Introduction
To achieve optimized AI performance, robust explainability, adaptability, and efficiency in healthcare solutions, InterSystems IRIS serves as the core foundation for a project within the x-rAI multi-agentic framework. This article provides an in-depth look at how InterSystems IRIS empowers the development of a real-time health data analytics platform, enabling advanced analytics and actionable insights. The solution leverages the strengths of InterSystems IRIS, including dynamic SQL, native vector search capabilities, distributed caching (ECP), and FHIR interoperability. This innovative approach directly aligns with the contest themes of "Using Dynamic SQL & Embedded SQL," "GenAI, Vector Search," and "FHIR, EHR," showcasing a practical application of InterSystems IRIS in a critical healthcare context.
System Architecture
The Health Agent in x-rAI is built on a modular architecture that integrates multiple components:
Data Ingestion Layer: Fetches real-time health data from wearable devices using the Terra API.
Data Storage Layer: Utilizes InterSystems IRIS for storing and managing structured health data.
Analytics Engine: Leverages InterSystems IRIS's vector search capabilities for similarity analysis and insights generation.
Caching Layer: Implements distributed caching via InterSystems IRIS Enterprise Cache Protocol (ECP) to enhance scalability.
Interoperability Layer: Uses FHIR standards to integrate with external healthcare systems like EHRs.
Below is a high-level architecture diagram:
[Wearable Devices] --> [Terra API] --> [Data Ingestion] --> [InterSystems IRIS] --> [Analytics Engine]
                                                          ------[Caching Layer]------
                                                          ----[FHIR Integration]-----
Technical Implementation
1. Real-Time Data Integration Using Dynamic SQL
The Health Agent ingests real-time health metrics (e.g., heart rate, steps, sleep hours) from wearable devices via the Terra API. This data is stored in InterSystems IRIS using dynamic SQL for flexibility in query generation.
Dynamic SQL Implementation
Dynamic SQL allows the system to adaptively construct queries based on incoming data structures.
def index_health_data_to_iris(data):
    conn = iris_connect()
    if conn is None:
        raise ConnectionError("Failed to connect to InterSystems IRIS.")
    try:
        with conn.cursor() as cursor:
            query = """
                INSERT INTO HealthData (user_id, heart_rate, steps, sleep_hours)
                VALUES (?, ?, ?, ?)
            """
            cursor.execute(query, (
                data['user_id'],
                data['heart_rate'],
                data['steps'],
                data['sleep_hours']
            ))
            conn.commit()
            print("Data successfully indexed into IRIS.")
    except Exception as e:
        print(f"Error indexing health data: {e}")
    finally:
        conn.close()
Benefits of Dynamic SQL
Enables flexible query construction based on incoming data schemas.
Reduces development overhead by avoiding hardcoded queries.
Supports seamless integration of new health metrics without modifying the database schema.
2. Advanced Analytics with Vector Search
InterSystems IRIS’s native vector datatype and similarity functions were utilized to perform vector search on health data. This allowed the system to identify historical records similar to a user’s current health metrics.
Vector Search Workflow
Convert health metrics (e.g., heart rate, steps, sleep hours) into a vector representation.
Store vectors in a dedicated column in the HealthData table.
Perform similarity searches using VECTOR_SIMILARITY().
SQL Query for Vector Search
SELECT TOP 3 user_id, heart_rate, steps, sleep_hours,
       VECTOR_SIMILARITY(vec_data, ?) AS similarity
FROM HealthData
ORDER BY similarity DESC;
Python Integration
def iris_vector_search(query_vector):
    conn = iris_connect()
    if conn is None:
        raise ConnectionError("Failed to connect to InterSystems IRIS.")
    try:
        with conn.cursor() as cursor:
            query_vector_str = ",".join(map(str, query_vector))
            sql = """
                SELECT TOP 3 user_id, heart_rate, steps, sleep_hours,
                       VECTOR_SIMILARITY(vec_data, ?) AS similarity
                FROM HealthData
                ORDER BY similarity DESC;
            """
            cursor.execute(sql, (query_vector_str,))
            results = cursor.fetchall()
            return results
    except Exception as e:
        print(f"Error performing vector search: {e}")
        return []
    finally:
        conn.close()
Benefits of Vector Search
Enables personalized recommendations by identifying historical patterns.
Enhances explainability by linking current metrics to similar past cases.
Optimized for high-speed analytics through SIMD (Single Instruction Multiple Data) operations.
3. Distributed Caching for Scalability
To handle increasing volumes of health data efficiently, the Health Agent leverages InterSystems IRIS’s Enterprise Cache Protocol (ECP). This distributed caching mechanism reduces latency and enhances scalability.
Key Features of ECP
Local caching on application servers minimizes central database queries.
Automatic synchronization ensures consistency across all cache nodes.
Horizontal scaling enables dynamic addition of application servers.
Caching Workflow
Frequently accessed health records are cached locally on application servers.
Subsequent queries for the same records are served directly from the cache.
Updates to cached records trigger automatic synchronization with the central database.
Benefits of Caching
Reduces query response times by serving requests from local caches.
Improves system scalability by distributing workload across multiple nodes.
Minimizes infrastructure costs by reducing central server load.
4. FHIR Integration for Interoperability
InterSystems IRIS’s support for FHIR (Fast Healthcare Interoperability Resources) ensured seamless integration with external healthcare systems like EHRs.
FHIR Workflow Wearable device data is transformed into FHIR-compatible resources (e.g., Observation, Patient).
These resources are stored in InterSystems IRIS and made accessible via RESTful APIs.
External systems can query or update these resources using standard FHIR endpoints.
Benefits of FHIR Integration
Ensures compliance with healthcare interoperability standards.
Facilitates secure exchange of health data between systems.
Enables integration with existing healthcare workflows and applications.
Explainable AI Through Real-Time Insights
By combining InterSystems IRIS’s analytics capabilities with x-rAI’s multi-agentic reasoning framework, the Health Agent generates actionable and explainable insights. For example:
"User 123 had similar metrics (Heart Rate: 70 bpm; Steps: 9,800; Sleep: 7 hrs). Based on historical trends, maintaining your current activity levels is recommended."
This transparency builds trust in AI-driven healthcare applications by providing clear reasoning behind recommendations.
Conclusion The integration of InterSystems IRIS into x-rAI’s Health Agent showcases its potential as a robust platform for building intelligent and explainable AI systems in healthcare. By leveraging features like dynamic SQL, vector search, distributed caching, and FHIR interoperability, this project delivers real-time insights that are both actionable and transparent—paving the way for more reliable AI applications in critical domains like healthcare.
Hi, this post was initially written for Caché. In June 2023, I finally updated it for IRIS. If you are revisiting the post since then, the only real change is substituting Caché for IRIS! I also updated the links for IRIS documentation and fixed a few typos and grammatical errors. Enjoy :)
In this post, I show strategies for backing up InterSystems IRIS using External Backup with examples of integrating with snapshot-based solutions. Most solutions I see today are deployed on Linux on VMware, so a lot of the post shows how solutions integrate VMware snapshot technology as examples.
IRIS online backup is included with an IRIS install for uninterrupted backup of IRIS databases. But there are more efficient backup solutions you should consider as systems scale up. External Backup integrated with snapshot technologies is the recommended solution for backing up systems, including IRIS databases.
Online documentation for External Backup has all the details. A key consideration is:
"To ensure the integrity of the snapshot, IRIS provides methods to freeze writes to databases while the snapshot is created. Only physical writes to the database files are frozen during the snapshot creation, allowing user processes to continue performing updates in memory uninterrupted."
It is also important to note that part of the snapshot process on virtualised systems causes a short pause on a VM being backed up, often called stun time. Usually less than a second, so not noticed by users or impacting system operation; however, in some circumstances, the stun can last longer. If the stun is longer than the quality of service (QoS) timeout for IRIS database mirroring, then the backup node will think there has been a failure on the primary and will failover. Later in this post, I explain how you can review stun times in case you need to change the mirroring QoS timeout.
You should also review IRIS online documentation Backup and Restore Guide for this post.
If you have nothing else, this comes in the box with the InterSystems data platform for zero downtime backups. Remember, IRIS online backup only backs up IRIS database files, capturing all blocks in the databases that are allocated for data with the output written to a sequential file. IRIS Online Backup supports cumulative and incremental backups.
In the context of VMware, an IRIS Online Backup is an in-guest backup solution. Like other in-guest solutions, IRIS Online Backup operations are essentially the same whether the application is virtualised or runs directly on a host. IRIS Online Backup must be coordinated with a system backup to copy the IRIS online backup output file to backup media and all other file systems used by your application. At a minimum, system backup must include the installation directory, journal and alternate journal directories, application files, and any directory containing external files the application uses.
IRIS Online Backup should be considered as an entry-level approach for smaller sites wishing to implement a low-cost solution to back up only IRIS databases or ad-hoc backups; for example, it is helpful in the set-up of mirroring. However, as databases increase in size and as IRIS is typically only part of a customer's data landscape, External Backups combined with snapshot technology and third-party utilities are recommended as best practice with advantages such as including the backup of non-database files, faster restore times, enterprise-wide view of data and better catalogue and management tools.
Using VMware as an example, Virtualising on VMware adds functionality and choices for protecting entire VMs. Once you have virtualised a solution, you have effectively encapsulated your system — including the operating system, the application and the data — all within .vmdk (and some other) files. When required, these files can be straightforward to manage and used to recover a whole system, which is very different from the same situation on a physical system where you must recover and configure the components separately -- operating system, drivers, third-party applications, database and database files, etc.
VMware’s vSphere Data Protection (VDP) and other third-party backup solutions for VM backup, such as Veeam or Commvault, take advantage of the functionality of VMware virtual machine snapshots to create backups. A high-level explanation of VMware snapshots follows; see the VMware documentation for more details.
It is important to remember that snapshots are applied to the whole VM and that the operating system and any applications or the database engine are unaware that the snapshot is happening. Also, remember:
By themselves, VMware snapshots are not backups!
Snapshots enable backup software to make backups, but they are not backups by themselves.
VDP and third-party backup solutions use the VMware snapshot process in conjunction with the backup application to manage the creation and, very importantly, deletion of snapshots. At a high level, the process and sequence of events for an external backup using VMware snapshots are as follows:
Backup solutions also use other features such as Change Block Tracking (CBT) to allow incremental or cumulative backups for speed and efficiency (especially important for space saving), and typically also add other important functions such as data deduplication and compression, scheduling, mounting VMs with changed IP addresses for integrity checks etc., full VM and file level restores, and catalogue management.
VMware snapshots that are not appropriately managed or left to run for a long time can use excessive storage (as more and more data is changed, delta files continue to grow) and also slow down your VMs.
You should think carefully before running a manual snapshot on a production instance. Why are you doing this? What will happen if you revert back in time to when the snapshot was created? What happens to all the application transactions between creation and rollback?
It is OK if your backup software creates and deletes a snapshot. The snapshot should only be around for a short time. And a crucial part of your backup strategy will be to choose a time when the system has low usage to minimise any further impact on users and performance.
Before the snapshot is taken, the database must be quiesced so that all pending writes are committed, and the database is in a consistent state. IRIS provides methods and an API to commit and then freeze (stop) writes to databases for a short period while the snapshot is created. This way, only physical writes to the database files are frozen during the creation of the snapshot, allowing user processes to continue performing updates in memory uninterrupted. Once the snapshot has been triggered, database writes are thawed, and the backup continues copying data to backup media. The time between freeze and thaw should be quick (a few seconds).
In addition to pausing writes, the IRIS freeze also handles switching journal files and writing a backup marker to the journal. The journal file continues to be written normally while physical database writes are frozen. If the system were to crash while the physical database writes are frozen, data would be recovered from the journal as usual during start-up.
The following diagram shows freeze and thaw with VMware snapshot steps to create a backup with a consistent database image.

Note the short time between Freeze and Thaw -- only the time to create the snapshot, not the time to copy the read-only parent to the backup target.
The process of freezing and thawing the database is crucial to ensure data consistency and integrity. This is because:
Data Consistency: IRIS can be writing journals, or the WIJ or doing random writes to the database at any time. A snapshot captures the state of the VM at a specific point in time. If the database is actively being written during the snapshot, it can lead to a snapshot that contains partial or inconsistent data. Freezing the database ensures that all transactions are completed and no new transactions start during the snapshot, leading to a consistent disk state.
Quiescing the File System: VMware's snapshot technology can quiesce the file system to ensure file system consistency. However, this does not account for the application or database level consistency. Freezing the database ensures that the database is in a consistent state at the application level, complementing VMware's quiescing.
Reducing Recovery Time: Restoring from a snapshot that was taken without freezing the database might require additional steps like database repair or consistency checks, which can significantly increase recovery time. Freezing and thawing ensure the database is immediately usable upon restoration, reducing downtime.
vSphere allows a script to be automatically called on either side of snapshot creation; this is when IRIS Freeze and Thaw are called. Note: For this functionality to work correctly, the ESXi host requests the guest operating system to quiesce the disks via VMware Tools.
VMware tools must be installed in the guest operating system.
The scripts must adhere to strict name and location rules. File permissions must also be set. For VMware on Linux, the script names are:
# /usr/sbin/pre-freeze-script
# /usr/sbin/post-thaw-script
Below are examples of freeze and thaw scripts our team use with Veeam backup for our internal test lab instances, but these scripts should also work with other solutions. These examples have been tested and used on vSphere 6 and Red Hat 7.
While these scripts can be used as examples and illustrate the method, you must validate them for your environments!
#!/bin/sh
#
# Script called by VMWare immediately prior to snapshot for backup.
# Tested on Red Hat 7.2
#

LOGDIR=/var/log
SNAPLOG=$LOGDIR/snapshot.log

echo >> $SNAPLOG
echo "`date`: Pre freeze script started" >> $SNAPLOG
exit_code=0

# Only for running instances
for INST in `iris qall 2>/dev/null | tail -n +3 | grep '^up' | cut -c5-  | awk '{print $1}'`; do

    echo "`date`: Attempting to freeze $INST" >> $SNAPLOG

    # Detailed instances specific log
    LOGFILE=$LOGDIR/$INST-pre_post.log

    # Freeze
    irissession $INST -U '%SYS' "##Class(Backup.General).ExternalFreeze(\"$LOGFILE\",,,,,,1800)" >> $SNAPLOG $
    status=$?

    case $status in
        5) echo "`date`:   $INST IS FROZEN" >> $SNAPLOG
           ;;
        3) echo "`date`:   $INST FREEZE FAILED" >> $SNAPLOG
           logger -p user.err "freeze of $INST failed"
           exit_code=1
           ;;
        *) echo "`date`:   ERROR: Unknown status code: $status" >> $SNAPLOG
           logger -p user.err "ERROR when freezing $INST"
           exit_code=1
           ;;
    esac
    echo "`date`:   Completed freeze of $INST" >> $SNAPLOG
done

echo "`date`: Pre freeze script finished" >> $SNAPLOG
exit $exit_code
#!/bin/sh
#
# Script called by VMWare immediately after backup snapshot has been created
# Tested on Red Hat 7.2
#

LOGDIR=/var/log
SNAPLOG=$LOGDIR/snapshot.log

echo >> $SNAPLOG
echo "`date`: Post thaw script started" >> $SNAPLOG
exit_code=0

if [ -d "$LOGDIR" ]; then

    # Only for running instances
    for INST in `iris qall 2>/dev/null | tail -n +3 | grep '^up' | cut -c5-  | awk '{print $1}'`; do

        echo "`date`: Attempting to thaw $INST" >> $SNAPLOG

        # Detailed instances specific log
        LOGFILE=$LOGDIR/$INST-pre_post.log

        # Thaw
        irissession $INST -U%SYS "##Class(Backup.General).ExternalThaw(\"$LOGFILE\")" >> $SNAPLOG 2>&1
        status=$?

        case $status in
            5) echo "`date`:   $INST IS THAWED" >> $SNAPLOG
               irissession $INST -U%SYS "##Class(Backup.General).ExternalSetHistory(\"$LOGFILE\")" >> $SNAPLOG$
               ;;
            3) echo "`date`:   $INST THAW FAILED" >> $SNAPLOG
               logger -p user.err "thaw of $INST failed"
               exit_code=1
               ;;
            *) echo "`date`:   ERROR: Unknown status code: $status" >> $SNAPLOG
               logger -p user.err "ERROR when thawing $INST"
               exit_code=1
               ;;
        esac
        echo "`date`:   Completed thaw of $INST" >> $SNAPLOG
    done
fi

echo "`date`: Post thaw script finished" >> $SNAPLOG
exit $exit_code
# sudo chown root.root /usr/sbin/pre-freeze-script /usr/sbin/post-thaw-script
# sudo chmod 0700 /usr/sbin/pre-freeze-script /usr/sbin/post-thaw-script
To test the scripts are running correctly, you can manually run a snapshot on a VM and check the script output. The following screenshot shows the "Take VM Snapshot" dialogue and options.

Deselect- "Snapshot the virtual machine's memory".
Select - the "Quiesce guest file system (Needs VMware Tools installed)" check box to pause running processes on the guest operating system so that file system contents are in a known consistent state when you take the snapshot.
Important! After your test, remember to delete the snapshot!!!!
If the quiesce flag is true, and the virtual machine is powered on when the snapshot is taken, VMware Tools is used to quiesce the file system in the virtual machine. Quiescing a file system is a process of bringing the on-disk data into a state suitable for backups. This process might include such operations as flushing dirty buffers from the operating system's in-memory cache to disk.
The following output shows the contents of the $SNAPSHOT log file set in the example freeze/thaw scripts above after running a backup that includes a snapshot as part of its operation.
Wed Jan  4 16:30:35 EST 2017: Pre freeze script started
Wed Jan  4 16:30:35 EST 2017: Attempting to freeze H20152
Wed Jan  4 16:30:36 EST 2017:   H20152 IS FROZEN
Wed Jan  4 16:30:36 EST 2017:   Completed freeze of H20152
Wed Jan  4 16:30:36 EST 2017: Pre freeze script finished

Wed Jan  4 16:30:41 EST 2017: Post thaw script started
Wed Jan  4 16:30:41 EST 2017: Attempting to thaw H20152
Wed Jan  4 16:30:42 EST 2017:   H20152 IS THAWED
Wed Jan  4 16:30:42 EST 2017:   Completed thaw of H20152
Wed Jan  4 16:30:42 EST 2017: Post thaw script finished
This example shows 6 seconds of elapsed time between freeze and thaw (16:30:36-16:30:42). User operations are NOT interrupted during this period. You will have to gather metrics from your own systems, but for some context, this example is from a system running an application benchmark on a VM with no IO bottlenecks and an average of more than 2 million Glorefs/sec, 170,000 Gloupds/sec, and an average 1,100 physical reads/sec and 3,000 writes per write daemon cycle.
Remember that memory is not part of the snapshot, so on restarting, the VM will reboot and recover. Database files will be consistent. You don’t want to "resume" a backup; you want the files at a known point in time. You can then roll forward journals and whatever other recovery steps are needed for the application and transactional consistency once the files are recovered.
For additional data protection, a journal switch can be done by itself, and journals can be backed up or replicated to another location, for example, hourly.
Below is the output of the $LOGFILE in the example freeze/thaw scripts above, showing journal details for the snapshot.
01/04/2017 16:30:35: Backup.General.ExternalFreeze: Suspending system

Journal file switched to:
/trak/jnl/jrnpri/h20152/H20152_20170104.011
01/04/2017 16:30:35: Backup.General.ExternalFreeze: Start a journal restore for this backup with journal file: /trak/jnl/jrnpri/h20152/H20152_20170104.011

Journal marker set at
offset 197192 of /trak/jnl/jrnpri/h20152/H20152_20170104.011
01/04/2017 16:30:36: Backup.General.ExternalFreeze: System suspended
01/04/2017 16:30:41: Backup.General.ExternalThaw: Resuming system
01/04/2017 16:30:42: Backup.General.ExternalThaw: System resumed
At the creation point of a VM snapshot and after the backup is complete and the snapshot is committed, the VM needs to be frozen for a short period. This short freeze is often referred to as stunning the VM. A good blog post on stun times is here. I summarise the details below and put them in the context of IRIS database considerations.
From the post on stun times: “To create a VM snapshot, the VM is “stunned” in order to (i) serialize device state to disk, and (ii) close the current running disk and create a snapshot point.…When consolidating, the VM is “stunned” in order to close the disks and put them in a state that is appropriate for consolidation.”
Stun time is typically a few 100 milliseconds; however, if there is a very high disk write activity during the commit phase, stun time could be several seconds.
If the VM is a Primary or Backup member participating in IRIS Database Mirroring and the stun time is longer than the mirror Quality of Service (QoS) timeout, the mirror will report the Primary VM as failed and initiate a mirror takeover.
Update March 2018: My colleague, Peter Greskoff, pointed out that a backup mirror member could initiate failover in as short a time as just over half QoS timeout during a VM stun or any other time the primary mirror member is unavailable.
For a detailed description of QoS considerations and failover scenarios, see this great post: Quality of Service Timeout Guide for Mirroring, however the short story regarding VM stun times and QoS is:
If the backup mirror does not receive any messages from the primary mirror within half of the QoS timeout, it will send a message to ensure the primary is still alive. The backup then waits an additional half QoS time for a response from the primary machine. If there is no response from the primary, it is assumed to be down, and the backup will take over.
On a busy system, journals are continuously sent from the primary to the backup mirror, and the backup would not need to check if the primary is still alive. However, during a quiet time — when backups are more likely to happen — if the application is idle, there may be no messages between the primary and backup mirror for more than half the QoS time.
Here is Peter’s example; Think about this time frame for an idle system with a QoS timeout of:08 seconds and a VM stun time of:07 seconds:
Please also read the section, Pitfalls and Concerns when Configuring your Quality of Service Timeout, in the linked post above to understand the balance to have QoS only as long as necessary. Having QoS too long, especially more than 30 seconds, can also cause problems.
End update March 2018:
For more information on Mirroring QoS, also see the documentation.
Strategies to keep stun time to a minimum include running backups when database activity is low and having well-set-up storage.
As noted above, when creating a snapshot, there are several options you can specify; one of the options is to include the memory state in the snapshot - Remember, memory state is NOT needed for IRIS database backups. If the memory flag is set, a dump of the internal state of the virtual machine is included in the snapshot. Memory snapshots take much longer to create. Memory snapshots are used to allow reversion to a running virtual machine state as it was when the snapshot was taken. This is NOT required for a database file backup.
When taking a memory snapshot, the entire state of the virtual machine will be stunned, stun time is variable.
As noted previously, for backups, the quiesce flag must be set to true for manual snapshots or by the backup software to guarantee a consistent and usable backup.
Starting from ESXi 5.0, snapshot stun times are logged in each virtual machine's log file (vmware.log) with messages similar to:
2017-01-04T22:15:58.846Z| vcpu-0| I125: Checkpoint_Unstun: vm stopped for 38123 us
Stun times are in microseconds, so in the above example, 38123 us is 38123/1,000,000 seconds or 0.038 seconds.
To be sure that stun times are within acceptable limits or to troubleshoot if you suspect long stun times are causing problems, you can download and review the vmware.log files from the folder of the VM that you are interested in. Once downloaded, you can extract and sort the log using the example Linux commands below.
There are several ways to download support logs, including creating a VMware support bundle through the vSphere management console or from the ESXi host command line. Consult the VMware documentation for all the details, but below is a simple method to create and gather a much smaller support bundle that includes the vmware.log file so you can review stun times.
You will need the long name of the directory where the VM files are located. Log on to the ESXi host where the database VM is running using ssh and use the command: vim-cmd vmsvc/getallvms to list vmx files and the long names unique associated with them.
For example, the long name for the example database VM used in this post is output as:
26 vsan-tc2016-db1 [vsanDatastore] e2fe4e58-dbd1-5e79-e3e2-246e9613a6f0/vsan-tc2016-db1.vmx rhel7_64Guest vmx-11
Next, run the command to gather and bundle only log files:vm-support -a VirtualMachines:logs.
The command will echo the location of the support bundle, for example:
To see the files collected, check '/vmfs/volumes/datastore1 (3)/esx-esxvsan4.iscinternal.com-2016-12-30--07.19-9235879.tgz'.
You can now use sftp to transfer the file off the host for further processing and review.
In this example, after uncompressing the support bundle navigate to the path corresponding to the database VMs long name. For example, in this case:
<bundle name>/vmfs/volumes/<host long name>/e2fe4e58-dbd1-5e79-e3e2-246e9613a6f0.
You will see several numbered log files; the most recent log file has no number, i.e. vmware.log. The log may be only a few 100 KB, but there is a lot of information; however, we care about the stun/unstun times, which are easy enough to find with grep. For example:
$ grep Unstun vmware.log
2017-01-04T21:30:19.662Z| vcpu-0| I125: Checkpoint_Unstun: vm stopped for 1091706 us
---
2017-01-04T22:15:58.846Z| vcpu-0| I125: Checkpoint_Unstun: vm stopped for 38123 us
2017-01-04T22:15:59.573Z| vcpu-0| I125: Checkpoint_Unstun: vm stopped for 298346 us
2017-01-04T22:16:03.672Z| vcpu-0| I125: Checkpoint_Unstun: vm stopped for 301099 us
2017-01-04T22:16:06.471Z| vcpu-0| I125: Checkpoint_Unstun: vm stopped for 341616 us
2017-01-04T22:16:24.813Z| vcpu-0| I125: Checkpoint_Unstun: vm stopped for 264392 us
2017-01-04T22:16:30.921Z| vcpu-0| I125: Checkpoint_Unstun: vm stopped for 221633 us
We can see two groups of stun times in the example, one from snapshot creation and a second set 45 minutes later for each disk when the snapshot is deleted/consolidated (e.g. after the backup software has completed copying the read-only vmx file). The above example shows that most stun times are sub-second, although the initial stun time is just over one second.
Short stun times are not noticeable to an end user. However, system processes such as IRIS Database Mirroring continuously monitor whether an instance is ‘alive’. If the stun time exceeds the mirroring QoS timeout, the node may be considered uncontactable and ‘dead’, and a failover will be triggered.
Tip: To review all the logs or for trouble-shooting, a handy command is to grep all the vmware*.log files and look for any outliers or instances where stun time is approaching QoS timeout. The following command pipes the output to awk for formatting:
grep Unstun vmware* | awk '{ printf ("%'"'"'d", $8)} {print " ---" $0}' | sort -nr
You should monitor your system regularly during normal operations to understand stun times and how they may impact QoS timeout for HA, such as mirroring. As noted, strategies to keep stun/unstun time to a minimum include running backups when database and storage activity is low and having well-set-up storage. For constant monitoring, logs may be processed by using VMware Log Insight or other tools.
In future posts, I will revisit backup and restore operations for InterSystems Data Platforms. But for now, if you have any comments or suggestions based on the workflows of your systems, please share them via the comments sections below.
There are often questions surrounding the ideal Apache HTTPD Web Server configuration for HealthShare. The contents of this article will outline the initial recommended web server configuration for any HealthShare product.
As a starting point, Apache HTTPD version 2.4.x (64-bit) is recommended. Earlier versions such as 2.2.x are available, however version 2.2 is not recommended for performance and scalability of HealthShare.
If you're running IRIS in a mirrored configuration for HA in Azure, the question of providing a Mirror VIP (Virtual IP) becomes relevant. Virtual IP offers a way for downstream systems to interact with IRIS using one IP address. Even when a failover happens, downstream systems can reconnect to the same IP address and continue working.
The main issue, when deploying to Azure, is that an IRIS VIP has a requirement of IRIS being essentially a network admin, per the docs.
To get HA, IRIS mirror members must be deployed to different availability zones in one subnet (which is possible in Azure as subnets can span several zones). One of the solutions might be load balancers, but they, of course, cost extra, and you need to administrate them.
In this article, I would like to provide a way to configure a Mirror VIP without the using Load Balancers suggested in most other Azure reference architectures.
We have a subnet running across two availability zones (I simplify here - of course, you'll probably have public subnets, arbiter in another az, and so on, but this is an absolute minimum enough to demonstrate this approach). Subnet's CIDR is 10.0.0.0/24, which means it is allocated IPs 10.0.0.1 to 10.0.0.255. As Azure reserves the first four addresses and the last address, we can use 10.0.0.4 to 10.0.0.254.
We will implement both public and private VIPs at the same time. If you want, you can implement only the private VIP.
Virtual Machines in Azure have Network Interfaces. These Network Interfaces have IP Configurations. IP configuration is a combination of Public and/or Private IPs, and it's routed automatically to the Virtual Machine associated with the Network interface. So there is no need to update the routes. What we'll do is, during a mirror failover event, delete the VIP IP configuration from the old primary and create it for a new primary. All operations to do that take 5-20 seconds for Private VIP only, from 5 seconds and up to a minute for a Public/Private VIP IP combination.
10.0.0.254.eth0:1 network interface.cat << EOFVIP >> /etc/sysconfig/network-scripts/ifcfg-eth0:1
DEVICE=eth0:1
ONPARENT=on
IPADDR=10.0.0.254
PREFIX=32
EOFVIP
sudo chmod -x /etc/sysconfig/network-scripts/ifcfg-eth0:1
sudo ifconfig eth0:1 up
If you want just to test, run (but it won't survive system restart):
sudo ifconfig eth0:1 10.0.0.254
Depending on the os you might need to run:
ifconfig eth0:1
systemctl restart network
{
  "roleName": "custom_nic_write",
  "description": "IRIS Role to assign VIP",
  "assignableScopes": [
    "/subscriptions/{subscriptionid}/resourceGroups/{resourcegroupid}/providers/Microsoft.Network/networkInterfaces/{nicid_primary}",
    "/subscriptions/{subscriptionid}/resourceGroups/{resourcegroupid}/providers/Microsoft.Network/networkInterfaces/{nicid_backup}"
  ],
  "permissions": [
    {
      "actions": [
        "Microsoft.Network/networkInterfaces/write",
        "Microsoft.Network/networkInterfaces/read"
      ],
      "notActions": [],
      "dataActions": [],
      "notDataActions": []
    }
  ]
}
For non-production environments you might use a Network Contributor system role on the resource group, but that is not a recommended approach as Network Contributor is a very broad role.
Here are the Azure CLI commands for both nodes assuming rg resource group, vip IP configuration, and my_vip_ip External IP:
az login --identity
az network nic ip-config delete --resource-group rg --name vip --nic-name mirrorb280_z2
az network nic ip-config create --resource-group rg --name vip --nic-name mirrora290_z1 --private-ip-address 10.0.0.254 --public-ip-address my_vip_ip
and:
az login --identity
az network nic ip-config delete --resource-group rg --name vip --nic-name mirrora290_z1
az network nic ip-config create --resource-group rg --name vip --nic-name mirrorb280_z2 --private-ip-address 10.0.0.254 --public-ip-address my_vip_ip
And the same code as a ZMIRROR routine:
ROUTINE ZMIRROR

NotifyBecomePrimary() PUBLIC {
    #include %occMessages
    set rg = "rg"
    set config = "vip"
    set privateVIP = "10.0.0.254"
    set publicVIP = "my_vip_ip"

    set nic = "mirrora290_z1"
    set otherNIC = "mirrorb280_z2"
    if ##class(SYS.Mirror).DefaultSystemName() [ "MIRRORB" {
        // we are on mirrorb node, swap
        set $lb(nic, otherNIC)=$lb(otherNIC, nic)
    }

    set rc1 = $zf(-100, "/SHELL", "export", "AZURE_CONFIG_DIR=/tmp", "&&", "az", "login", "--identity")
    set rc2 = $zf(-100, "/SHELL", "export", "AZURE_CONFIG_DIR=/tmp", "&&", "az", "network", "nic", "ip-config", "delete", "--resource-group", rg, "--name", config, "--nic-name", otherNIC)
    set rc3 = $zf(-100, "/SHELL", "export", "AZURE_CONFIG_DIR=/tmp", "&&", "az", "network", "nic", "ip-config", "create", "--resource-group", rg, "--name", config, "--nic-name",      nic,  "--private-ip-address", privateVIP, "--public-ip-address", publicVIP)
    quit 1
}
The routine is the same for both mirror members, we just swap the NIC names based on a current mirror member name. You might not need export AZURE_CONFIG_DIR=/tmp, but sometimes az tries to write credentials into the root home dir, which might fail. Instead of /tmp, it's better to use the IRIS user's home subdirectory (or you might not even need that environment variable, depending on your setup).
And if you want to use Embedded Python, here's Azure Python SDK code:
from azure.identity import DefaultAzureCredential
from azure.mgmt.network import NetworkManagementClient
from azure.mgmt.network.models import NetworkInterface, NetworkInterfaceIPConfiguration, PublicIPAddress

sub_id = "AZURE_SUBSCRIPTION_ID"
client = NetworkManagementClient(credential=DefaultAzureCredential(), subscription_id=sub_id)

resource_group_name = "rg"
nic_name = "mirrora290_z1"
other_nic_name = "mirrorb280_z2"
public_ip_address_name = "my_vip_ip"
private_ip_address = "10.0.0.254"
vip_configuration_name = "vip"


# remove old VIP configuration
nic: NetworkInterface = client.network_interfaces.get(resource_group_name, other_nic_name)
ip_configurations_old_length = len(nic.ip_configurations)
nic.ip_configurations[:] = [ip_configuration for ip_configuration in nic.ip_configurations if
                            ip_configuration.name != vip_configuration_name]

if ip_configurations_old_length != len(nic.ip_configurations):
    poller = client.network_interfaces.begin_create_or_update(
        resource_group_name,
        other_nic_name,
        nic
    )
    nic_info = poller.result()

# add new VIP configuration
nic: NetworkInterface = client.network_interfaces.get(resource_group_name, nic_name)
ip: PublicIPAddress = client.public_ip_addresses.get(resource_group_name, public_ip_address_name)
vip = NetworkInterfaceIPConfiguration(name=vip_configuration_name,
                                      private_ip_address=private_ip_address,
                                      private_ip_allocation_method="Static",
                                      public_ip_address=ip,
                                      subnet=nic.ip_configurations[0].subnet)
nic.ip_configurations.append(vip)

poller = client.network_interfaces.begin_create_or_update(
    resource_group_name,
    nic_name,
    nic
)
nic_info = poller.result()
NotifyBecomePrimary is also called automatically on system start (after mirror reconnection), but if you want your non-mirrored environments to acquire VIP the same way use ZSTART routine:
SYSTEM() PUBLIC {
  if '$SYSTEM.Mirror.IsMember() {
    do NotifyBecomePrimary^ZMIRROR()
  }
  quit 1
}
And that's it! We change IP configuration pointing to a current mirror Primary when the NotifyBecomePrimary event happens.
I am often asked by customers, vendors or internal teams to explain CPU capacity planning for large production databases running on VMware vSphere.
In summary there are a few simple best practices to follow for sizing CPU for large production databases:
Generally this leads to a couple of common questions:
I answer these questions with examples below. Bust also remember, best practices are not written in stone. Sometimes you need to make compromises. For example, it is likely that large production database VMs will NOT fit in a NUMA node, and as we will see that’s OK. Best practices are guidelines that you will have to evaluate and validate for your applications and environment.
Although I am writing this with examples for databases running on InterSystems data platforms, the concepts and rules apply generally for capacity and performance planning for any large (Monster) VMs.
This post is mostly about deploying _Monster VMs _, sometimes called Wide VMs. The CPU resource requirements of high transaction databases mean they are often deployed on Monster VMs.
A monster VM is a VM with more Virtual CPUs or memory than a physical NUMA node.
Current Intel processor architecture has Non-Uniform Memory Architecture (NUMA) architecture. For example, the servers I am using to run tests for this post have:
Each 12-core processor has its own local memory (128GB of RDIMMs and local cache) and can also access memory on other processors in the same host. Each 12-core package of CPU, CPU cache and 128 GB RDIMM memory is a NUMA node. To access memory on another processor NUMA nodes are connected by a fast inter-connect.
Processes running on a processor accessing local RDIMM and Cache memory have lower latency than going across the interconnect to access remote memory on another processor. Access across the interconnect increases latency, so performance is non-uniform. The same design applies to servers with more than two sockets. A four socket Intel server has four NUMA nodes.
ESXi understands physical NUMA and the ESXi CPU scheduler is designed to optimise performance on NUMA systems. One of the ways ESXi maximises performance is to create data locality on a physical NUMA node. In our example if you have a VM with 12 vCPU and less than 128GB memory, ESXi will assign that VM to run on one of the physical NUMA nodes. Which leads to the rule;
If possible size VMs to keep CPU and memory local to a NUMA node.
If you need a Monster VM larger than a NUMA node that is OK, ESXi does a very good job of automatically calculating and managing requirements. For example, ESXi will create virtual NUMA nodes (vNUMA) that intelligently schedule onto the physical NUMA nodes for optimal performance. The vNUMA structure is exposed to the operating system. For example, if you have a host server with two 12-core processors and a VM with 16 vCPUs ESXi may use eight physical cores on on each of two processors to schedule VM vCPUs, the operating system (Linux or Windows) will see two NUMA nodes.
It is also important to right-size your VMs and not allocate more resources than are needed as that can lead to wasted resources and loss of performance. As well as helping you size for NUMA, it is more efficient and will result in better performance, to have a 12 vCPU VM with high (but safe) CPU utilisation than a 24 vCPU VM with low or middling VM CPU utilisation, especially if there are other VMs on this host needing to be scheduled and competing for resources. This also re-enforces the rule;
Right-size virtual machines.
Note: There are differences between Intel and AMD implementations of NUMA. AMD has multiple NUMA nodes per processor. It’s been a while since I have seen AMD processors in a customer server, but if you have them review NUMA layout as part of your planning.
For best NUMA scheduling configure wide VMs;
Correction June 2017: Configure VMs with 1 vCPU per socket.
For example, by default a VM with 24 vCPUs should be configured as 24 CPU sockets each with one core.
Follow VMware best practice rules .
Please see this post on the VMware blogs for examples.
The VMware blog post goes into detail, but the author, Mark Achtemichuk, recommends the following rules of thumb:
Caché licensing counts cores so this is not a problem, however for software or databases other than Caché specifying that a VM has 24 sockets could make a difference to software licensing so you must check with vendors.
Hyper-threading (HT) often comes up in discussions, I hear; “hyper-threading doubles the number of CPU cores”. Which obviously at the physical level it can’t — you have as many physical cores as you have. Hyper-threading should be enabled and will increase system performance. An expectation is maybe 20% or more application performance increase, but the actual amount is dependant on the application and the workload. But certainly not double.
As I posted in the VMware best practice post, a good starting point for sizing large production database VMs is to assume is that the vCPU has full physical core dedication on the server —basically ignore hyper-threading when capacity planning. For example;
For a 24-core host server plan for a total of up to 24 vCPU for production database VMs knowing there may be available headroom.
Once you have spent time monitoring the application, operating system and VMware performance during peak processing times you can decide if higher VM consolidation is possible. In the best practice post I stated the rule as;
One physical CPU (includes hyper-threading) = One vCPU (includes hyper-threading).
HT on Intel Xeon processors is a way of creating two logical CPUs on one physical core. The operating system can efficiently schedule against the two logical processors — if a process or thread on a logical processor is waiting, for example for IO, the physical CPU resources can be used by the other logical processor. Only one logical processor can be progressing at any point in time, so although the physical core is more efficiently utilised performance is not doubled.
With HT enabled in the host BIOS, when creating a VM you can configure a vCPU per HT logical processor. For example, on a 24-physical core server with HT enabled you can create a VM with up to 48 vCPUS. The ESXi CPU scheduler will optimise processing by running VMs processes on separate physical cores first (while still considering NUMA). I explore later in the post whether allocating more vCPUs than physical cores on a Monster database VM helps scaling.
After monitoring host and application performance you may decide that some overcommitment of host CPU resources is possible. Whether this is a good idea will be very dependant on the applications and workloads. An understanding of the schedular and a key metric to monitor can help you be sure that you are not over committing host resources.
I sometimes hear; for a VM to be progressing there must be the same number of free logical CPUs as there are vCPUs in the VM. For example, a 12 vCPU VM must ‘wait’ for 12 logical CPUs to be ‘available’ before execution progresses. However it should be noted that ESXi after version 3 this is not the case. ESXi uses relaxed co-scheduling for CPU for better application performance.
Because multiple cooperating threads or processes frequently synchronise with each other not scheduling them together can increase latency in their operations. For example a thread waiting to be scheduled by another thread in a spin loop. For best performance ESXi tries to schedule as many sibling vCPUs together as possible. But the CPU scheduler can flexibly schedule vCPUs when there a multiple VMs competing for CPU resources in a consolidated environment. If there is too much time difference as some vCPUs make progress while siblings don’t (the time difference is called skew) then the leading vCPU will decide whether to stop itself (co-stop). Note that it is vCPUs that co-stop (or co-start), not the entire VM. This works very well when even when there is some over commitment of resources, however as you would expect; too much over commitment of CPU resources will inevitably impact performance. I show an example of over commitment and co-stop later in Example 2.
Remember it is not a flat-out race for CPU resources between VMs; the ESXi CPU scheduler’s job is to ensure that policies such as CPU shares, reservations and limits are followed while maximising CPU utilisation and to ensure fairness, throughput, responsiveness and scalability. A discussion of using reservations and shares to prioritise production workloads is beyond the scope of this post and dependant on your application and workload mix. I may revisit this at a later time if I find any Caché specific recommendations. There are many factors that come into play with the CPU scheduler, this section just skims the surface. For a deep dive see the VMware white paper and other links in the references at the end of the post.
To illustrate the different vCPU configurations, I ran a series of benchmarks using a high transaction rate browser based Hospital Information System application. A similar concept to the DVD Store database benchmark developed by VMware.
The scripts for the benchmark are created based on observations and metrics from live hospital implementations and include high use workflows, transactions and components that use the highest system resources. Driver VMs on other hosts simulate web sessions (users) by executing scripts with randomised input data at set workflow transaction rates. A benchmark with a rate of 1x is the baseline. Rates can be scaled up and down in increments.
Along with the database and operating system metrics a good metric to gauge how the benchmark database VM is performing is component (also could be a transaction) response time as measured on the server. An example of a component is part of an end user screen. An increase in component response time means users would start to see a change for the worse in application response time. A well performing database system must provide consistent high performance for end users. In the following charts, I am measuring against consistent test performance and an indication of end user experience by averaging the response time of the 10 slowest high-use components. Average component response time is expected to be sub-second, a user screen may be made up of one component, or complex screens may have many components.
Remember you are always sizing for peak workload, plus a buffer for unexpected spikes in activity. I usually aim for average 80% peak CPU utilisation.
A full list of benchmark hardware and software is at the end of the post.
It is possible to create a database VM that is sized to use all the physical cores of a host server, for example a 24 vCPU VM on the 24 physical core host. Rather than run the server “bare-metal” in a Caché database mirror for HA or introduce the complication of operating system failover clustering, the database VM is included in a vSphere cluster for management and HA, for example DRS and VMware HA.
I have seen customers follow old-school thinking and size a primary database VM for expected capacity at the end of five years hardware life, but as we know from above it is better to right-size; you will get better performance and consolidation if your VMs are not oversized and managing HA will be easier; think Tetris if there is maintenance or host failure and the database monster VM has to migrate or restart on another host. If transaction rate is forecast to increase significantly vCPUs can be added ahead of time during planned maintenance.
Note, 'hot add' CPU option disables vNUMA so do not use it for monster VMs.
Consider the following chart showing a series of tests on the 24-core host. 3x transaction rate is the sweet spot and the capacity planning target for this 24-core system.
There is a lot going on in this chart, but we can focus on a couple of interesting things.
So much for right-sizing, what about increasing vCPUs, that means using hyper threads. Is it possible to double performance and scalability? The short answer is No!
In this case the answer can be seen by looking at component response time from 4x onwards. While the performance is ‘better’ with more logical cores (vCPUs) allocated, it is still not flat and as consistent as it was up to 3x. Users will be reporting slower response times at 4x no matter how many vCPUs are allocated. Remember at 4x the _host _ is already flat-lined at 100% CPU utilisation as reported by vSphere. At higher vCPU counts even though in-guest CPU metrics (vmstat) are reporting less than 100% utilisation this is not the case for physical resources. Remember the guest operating system does not know it is virtualised and is just reporting on resources presented to it. Also note the guest operating system does not see HT threads, all vCPUs are presented as physical cores.
The point is that database processes (there are more than 200 Caché processes at 3x transaction rate) are very busy and make very efficient use of processors, there is not a lot of slack for logical processors to schedule more work, or consolidate more VMs to this host. For example, a large part of Caché processing is happening in-memory so there is not a lot of wait on IO. So while you can allocate more vCPUs than physical cores there is not a lot to be gained because the host is already 100% utilised.
Caché is very good at handling high workloads. Even when the host and VM are at 100% CPU utilisation the application is still running, and transaction rate is still increasing — scaling is not linear, and as we can see response times are getting longer and user experience will suffer — but the application does not ‘fall off a cliff’ and although not a good place to be users can still work. If you have an application that is not so sensitive to response times it is good to know you can push to the edge, and beyond, and Caché still works safely.
Remember you do not want to run your database VM or your host at 100% CPU. You need capacity for unexpected spikes and growth in the VM, and ESXi hypervisor needs resources for all the networking, storage and other activities it does.
I always plan for peaks of 80% CPU utilisation. Even then sizing vCPU only up to the number of physical cores leaves some headroom for ESXi hypervisor on logical threads even in extreme situations.
If you are running a hyper-converged (HCI) solution you MUST also factor in HCI CPU requirements at the host level. See my previous post on HCI for more details. Basic CPU sizing of VMs deployed on HCI is the same as other VMs.
Remember, You must validate and test everything in your own environment and with your applications.
I have seen customer sites reporting ‘slow’ application performance while the guest operating system reports there are CPU resources to spare.
Remember the guest operating system does not know it is virtualised. Unfortunately in-guest metrics, for example as reported by vmstat (for example in pButtons) can be deceiving, you must also get host level metrics and ESXi metrics (for example esxtop) to truly understand system health and capacity.
As you can see in the chart above when the host is reporting 100% utilisation the guest VM can be reporting a lower utilisation. The 36 vCPU VM (red) is reporting 80% average CPU utilisation at 4x rate while the host is reporting 100%. Even a right-sized VM can be starved of resources, if for example, after go-live other VMs are migrated on to the host, or resources are over-committed through badly configured DRS rules.
To show key metrics, for this series of tests I configured the following;
With another database using resources; at 3x rate, the guest OS (RHEL 7) vmstat is only reporting 86% average CPU utilisation and the run queue is only averaging 25. However, users of this system will be complaining loudly as the component response time shot up as processes are slowed.
As shown in the following chart Co-stop and Ready Time tell the story why user performance is so bad. Ready Time (%RDY) and CoStop (%CoStop) metrics show CPU resources are massively over committed at the target 3x rate. This should not really be a surprise as the host is running 2x (other VM) and this database VMs 3x rate.
The chart shows Ready time increases when total CPU load on the host increases.
Ready time is time that a VM is ready to run but cannot because CPU resources are not available.
Co-stop also increases. There are not enough free logical CPUs to allow the database VM to progress (as I detailed in the HT section above). The end result is processing is delayed due to contention for physical CPU resources.
I have seen exactly this situation at a customer site where our support view from pButtons and vmstat only showed the virtualised operating system. While vmstat reported CPU headroom user performance experience was terrible.
The lesson here is it was not until ESXi metrics and a host level view was made available that the real problem was diagnosed; over committed CPU resources caused by general cluster CPU resource shortage and to make the situation worse bad DRS rules causing high transaction database VMs to migrate together and overwhelm host resources.
In this example I used a baseline 24 vCPU database VM running at 3x transaction rate, then two 24 vCPU database VMs at a constant 3x transaction rate.
The average baseline CPU utilisation (see Example 1 above) was 76% for the VM and 85% for the host. A single 24 vCPU database VM is using all 24 physical processors. Running two 24 vCPU VMs means the VMs are competing for resources and are using all 48 logical execution threads on the server.
Remembering that the host was not 100% utilised with a single VM, we can still see a significant drop in throughput and performance as two very busy 24 vCPU VMs attempt to use the 24 physical cores on the host (even with HT). Although Caché is very efficient using the available CPU resources there is still a 16% drop in database throughput per VM, and more importantly a more than 50% increase in component (user) response time.
My aim for this post is to answer the common questions. See the reference section below for a deeper dive into CPU host resources and the VMware CPU schedular.
Even though there are many levels of nerd-knob twiddling and ESXi rat holes to go down to squeeze the last drop of performance out of your system, the basic rules are pretty simple.
For large production databases :
If you want to consolidate VMs remember large databases are very busy and will heavily utilise CPUs (physical and logical) at peak times. Don't oversubscribe them until your monitoring tells you it is safe.
I ran the examples in this post on a vSphere cluster made up of two processor Dell R730’s attached to an all flash array. During the examples there was no bottlenecks on the network or storage.
PowerEdge R730
PowerVault MD3420, 12G SAS, 2U-24 drive
VMware ESXi 6.0.0 build-2494585
RHEL 7
Baseline 1x rate averaged 700,000 glorefs/second (database access/second). 5x rate averaged more than 3,000,000 glorefs/second for 24 vCPUs. The tests were allowed to burn in until constant performance is achieved and then 15 minute samples were taken and averaged.
These examples only to show the theory, you MUST validate with your own application!
InterSystems is pleased to announce the central component for InterSystems Supply Chain Orchestrator™, the 2023.1 release of InterSystems IRIS for Supply Chain, is now Generally Available (GA).
I'm working with clients planning migrate from Caché to IRIS and I want to summary advantages to go to IRIS. I think is:
Can you help me to think or detail these 10 topics?
Hey Developers,
Enjoy watching the new video on InterSystems Developers YouTube:
⏯ Breaking Data Silos Through Strategic Healthcare Partnerships @ Global Summit 2022
Hi,
This is Jayanth from OAK Technologies.
Hope you are all doing well!!
We have a position for InterSystems IRIS Technology Role for our client if anyone is interested, please drop your resume to jayanth@oaktechinc.com
Job Role: IRIS technology role
Location: Chicago, Illinois (Remote Work)
Contract:1+ Year W2 OR 1099 Contact
The Amazon Web Services (AWS) Cloud provides a broad set of infrastructure services, such as compute resources, storage options, and networking that are delivered as a utility: on-demand, available in seconds, with pay-as-you-go pricing. New services can be provisioned quickly, without upfront capital expense. This allows enterprises, start-ups, small and medium-sized businesses, and customers in the public sector to access the building blocks they need to respond quickly to changing business requirements.
Updated: 10-Jan, 2023
Released with no formal announcement in IRIS preview release 2019.4 is the /api/monitor service exposing IRIS metrics in Prometheus format. Big news for anyone wanting to use IRIS metrics as part of their monitoring and alerting solution. The API is a component of the new IRIS System Alerting and Monitoring (SAM) solution that will be released in an upcoming version of IRIS.
However, you do not have to wait for SAM to start planning and trialling this API to monitor your IRIS instances. In future posts, I will dig deeper into the metrics available and what they mean and provide example interactive dashboards. But first, let me start with some background and a few questions and answers.
IRIS (and Caché) is always collecting dozens of metrics about itself and the platform it is running on. There have always been multiple ways to collect these metrics to monitor Caché and IRIS. I have found that few installations use IRIS and Caché built-in solutions. For example, History Monitor has been available for a long time as a historical database of performance and system usage metrics. However, there was no obvious way to surface these metrics and instrument systems in real-time.
IRIS platform solutions (along with the rest of the world) are moving from single monolithic applications running on a few on-premises instances to distributed solutions deployed 'anywhere'. For many use cases existing IRIS monitoring options do not fit these new paradigms. Rather than completely reinvent the wheel InterSystems looked to popular and proven current Open Source solutions for monitoring and alerting.
Prometheus is a well known and widely deployed open source monitoring system based on proven technology. It has a wide variety of plugins. It is designed to work well within the cloud environment, but also is just as useful for on-premises. Plugins include operating systems, web servers such as Apache and many other applications. Prometheus is often used with a front end client, for example, Grafana, which provides a great UI/UX experience that is extremely customisable.
Grafana is also open source. As this series of posts progresses, I will provide sample templates of monitoring dashboards for common scenarios. You can use the samples as a base to design dashboards for what you care about. The real power comes when you combine IRIS metrics in context with metrics from your whole solution stack. From the platform components, operating system, IRIS and especially when you add instrumentation from your applications.
Monitoring IRIS and Caché with Prometheus and Grafana is not new. I have been using these applications for several years to monitor my development and test systems. If you search the Developer Community for "Prometheus", you will find other posts (for example, some excellent posts by Mikhail Khomenko) that show how to expose Caché metrics for use by Prometheus.
The difference now is that the /api/monitor API is included and enabled by default. There is no requirement to code your own classes to expose metrics.
Here is a quick orientation to Prometheus and some terminology. I want you to see the high level and to lay some groundwork and open the door to how you think of visualising or consuming the metrics provided by IRIS or other sources.
Prometheus works by scraping or pulling time series data exposed from applications as HTTP endpoints (APIs such as IRIS /api/monitor). Exporters and client libraries exist for many languages, frameworks, and open-source applications — for example, for web servers like Apache, operating systems, docker, Kubernetes, databases, and now IRIS.
Exporters are used to instrument applications and services and to expose relevant metrics on an endpoint for scraping. Standard components such as web servers, databases, and the like - are supported by core exporters. Many other exporters are available open-source from the Prometheus community.
A few key terms are useful to know:
** Spoiler Alert; For security, scaling, high availability and some other operational efficiency reasons, for the new SAM solution the database used for Prometheus time-series data is IRIS! However, access to the Prometheus database -- on IRIS -- is transparent, and applications such as Grafana do not know or care.
Metrics returned by the API are in Prometheus format. Prometheus uses a simple text-based metrics format with one metric per line, the format is;
<identifier> [ (time n, value n), ....]
Metrics can have labels as (key, value) pairs. Labels are a powerful way to filter metrics as dimensions. As an example, examine a single metric returned for IRIS /api/monitor. In this case journal free space:
iris_jrn_free_space{id="WIJ",dir=”/fast/wij/"} 401562.83
The identifier tells you what the metric is and where it came from:
iris_jrn_free_space
Multiple labels can be used to decorate the metrics, and then used to filter and query. In this example, you can see the WIJ and the directory where the WIJ is stored:
id="WIJ",dir="/fast/wij/"
And a value: 401562.83 (MB).
The preview documentation has a list of metrics. However, be aware there may be changes. You can also simply query the /api/monitor/metrics endpoint and see the list. I use Postman which I will demonstrate in the next community post.
Keep these points in mind as you think about how you will monitor your systems and applications.
Documentation and downloads for: Prometheus and Grafana
I presented a pre-release overview of SAM (including Prometheus and Grafana) at InterSystems Global Summit 2019 you can find the link at InterSystems learning services. If the direct link does not work go to the InterSystems learning services web site and search for: "System Alerting and Monitoring Made Easy"
Search here on the community for "Prometheus" and "Grafana".
The following steps show you how to display a sample list of metrics available from the /api/monitor service.
In the last post, I gave an overview of the service that exposes IRIS metrics in Prometheus format. The post shows how to set up and run IRIS preview release 2019.4 in a container and then list the metrics.
This post assumes you have Docker installed. If not, go and do that now for your platform :)
Follow the download instructions at Preview Distributions to download the Preview Licence Key and an IRIS Docker image. For the example, I have chosen InterSystems IRIS for Health 2019.4.
Follow the instructions at First Look InterSystems Products in Docker Containers. If you are familiar with containers, jump to the section titled: Download the InterSystems IRIS Docker Image.
The following terminal output illustrates the processes I used to load the docker image. The docker load command may take a couple of minutes to run;
$ pwd
/Users/myhome/Downloads/iris_2019.4

$ ls
InterSystems IRIS for Health (Container)_2019.4.0_Docker(Ubuntu)_12-31-2019.ISCkey	irishealth-2019.4.0.379.0-docker.tar

$ docker load -i irishealth-2019.4.0.379.0-docker.tar
762d8e1a6054: Loading layer [==================================================>]  91.39MB/91.39MB
e45cfbc98a50: Loading layer [==================================================>]  15.87kB/15.87kB
d60e01b37e74: Loading layer [==================================================>]  12.29kB/12.29kB
b57c79f4a9f3: Loading layer [==================================================>]  3.072kB/3.072kB
b11f1f11664d: Loading layer [==================================================>]  73.73MB/73.73MB
22202f62822e: Loading layer [==================================================>]  2.656GB/2.656GB
50457c8fa41f: Loading layer [==================================================>]   14.5MB/14.5MB
bc4f7221d76a: Loading layer [==================================================>]  2.048kB/2.048kB
4db3eda3ff8f: Loading layer [==================================================>]  1.491MB/1.491MB
Loaded image: intersystems/irishealth:2019.4.0.379.0

$ docker images
REPOSITORY                TAG                 IMAGE ID            CREATED             SIZE
intersystems/irishealth   2019.4.0.379.0      975a976ad1f4        3 weeks ago         2.83GB
For simplicity copy the key file to a folder location you will use for persistent storage and rename to iris.key;
$ mkdir -p /Users/myhome/iris/20194
$ cp 'InterSystems IRIS for Health (Container)_2019.4.0_Docker(Ubuntu)_12-31-2019.ISCkey' /Users/myhome/iris/20194/iris.key

$ cd /Users/myhome/iris/20194
$ ls
iris.key
Start IRIS using the folder you created for persistent storage;
$  docker run --name iris --init --detach --publish 52773:52773 --volume `pwd`:/external intersystems/irishealth:2019.4.0.379.0 --key /external/iris.key

$ docker ps -a
CONTAINER ID        IMAGE                                    COMMAND                  CREATED              STATUS                        PORTS                      NAMES
009e52c121f0        intersystems/irishealth:2019.4.0.379.0   "/iris-main --key /e…"   About a minute ago   Up About a minute (healthy)   0.0.0.0:52773->52773/tcp   iris
Cool! You can now connect to the System Management Portal on the running container. I used login/password SuperUser/SYS; you will be prompted to change the password first time.
Navigate to Web Applications. System > Security Management > Web Applications
You will see a Web Application: /api/monitor this is the service exposing IRIS metrics.
You do not have to do anything to return metrics, it just works.
In later posts, we will scrape this endpoint with Prometheus or SAM to collect metrics at set intervals. But for now, let us see the full list of metrics returned for this instance. A simple way, for example on Linux and OSX, is to issue an HTTP GET using the curl command. For example; on my (pretty much inactive) container the list starts with;
$ curl localhost:52773/api/monitor/metrics
:
:
iris_cpu_usage 0
iris_csp_activity{id="127.0.0.1:52773"} 56
iris_csp_actual_connections{id="127.0.0.1:52773"} 8
iris_csp_gateway_latency{id="127.0.0.1:52773"} .588
iris_csp_in_use_connections{id="127.0.0.1:52773"} 1
iris_csp_private_connections{id="127.0.0.1:52773"} 0
iris_csp_sessions 1
iris_cache_efficiency 35.565
:
:
And so on. The list can be very long on a production system. I have dumped the full list at the end of the post.
Another useful way is to use the Postman application, but there are other ways. Assuming you have installed Postman for your platform, you can issue an HTTP GET and see the metrics returned.
That is all for now. In the next post, I will start with collecting the data in Prometheus and look at a sample Grafana dashboard.
A production system will have more metrics available. As you can see from some of the labels, for example; {id="IRISLOCALDATA"} there are some metrics that are per-database or for CPU by process type {id="CSPDMN"}.
iris_cpu_pct{id="CSPDMN"} 0
iris_cpu_pct{id="CSPSRV"} 0
iris_cpu_pct{id="ECPWorker"} 0
iris_cpu_pct{id="GARCOL"} 0
iris_cpu_pct{id="JRNDMN"} 0
iris_cpu_pct{id="LICENSESRV"} 0
iris_cpu_pct{id="WDSLAVE"} 0
iris_cpu_pct{id="WRTDMN"} 0
iris_cpu_usage 0
iris_csp_activity{id="127.0.0.1:52773"} 57
iris_csp_actual_connections{id="127.0.0.1:52773"} 8
iris_csp_gateway_latency{id="127.0.0.1:52773"} .574
iris_csp_in_use_connections{id="127.0.0.1:52773"} 1
iris_csp_private_connections{id="127.0.0.1:52773"} 0
iris_csp_sessions 1
iris_cache_efficiency 35.850
iris_db_expansion_size_mb{id="ENSLIB"} 0
iris_db_expansion_size_mb{id="HSCUSTOM"} 0
iris_db_expansion_size_mb{id="HSLIB"} 0
iris_db_expansion_size_mb{id="HSSYS"} 0
iris_db_expansion_size_mb{id="IRISAUDIT"} 0
iris_db_expansion_size_mb{id="IRISLOCALDATA"} 0
iris_db_expansion_size_mb{id="IRISSYS"} 0
iris_db_expansion_size_mb{id="IRISTEMP"} 0
iris_db_free_space{id="ENSLIB"} .055
iris_db_free_space{id="HSCUSTOM"} 2.3
iris_db_free_space{id="HSLIB"} 113
iris_db_free_space{id="HSSYS"} 9.2
iris_db_free_space{id="IRISAUDIT"} .094
iris_db_free_space{id="IRISLOCALDATA"} .34
iris_db_free_space{id="IRISSYS"} 6.2
iris_db_free_space{id="IRISTEMP"} 20
iris_db_latency{id="ENSLIB"} 0.030
iris_db_latency{id="HSCUSTOM"} 0.146
iris_db_latency{id="HSLIB"} 0.027
iris_db_latency{id="HSSYS"} 0.018
iris_db_latency{id="IRISAUDIT"} 0.017
iris_db_latency{id="IRISSYS"} 0.020
iris_db_latency{id="IRISTEMP"} 0.021
iris_db_max_size_mb{id="ENSLIB"} 0
iris_db_max_size_mb{id="HSCUSTOM"} 0
iris_db_max_size_mb{id="HSLIB"} 0
iris_db_max_size_mb{id="HSSYS"} 0
iris_db_max_size_mb{id="IRISAUDIT"} 0
iris_db_max_size_mb{id="IRISLOCALDATA"} 0
iris_db_max_size_mb{id="IRISSYS"} 0
iris_db_max_size_mb{id="IRISTEMP"} 0
iris_db_size_mb{id="HSLIB",dir="/usr/irissys/mgr/hslib/"} 1321
iris_db_size_mb{id="HSSYS",dir="/usr/irissys/mgr/hssys/"} 21
iris_db_size_mb{id="ENSLIB",dir="/usr/irissys/mgr/enslib/"} 209
iris_db_size_mb{id="IRISSYS",dir="/usr/irissys/mgr/"} 113
iris_db_size_mb{id="HSCUSTOM",dir="/usr/irissys/mgr/HSCUSTOM/"} 11
iris_db_size_mb{id="IRISTEMP",dir="/usr/irissys/mgr/iristemp/"} 21
iris_db_size_mb{id="IRISAUDIT",dir="/usr/irissys/mgr/irisaudit/"} 1
iris_db_size_mb{id="IRISLOCALDATA",dir="/usr/irissys/mgr/irislocaldata/"} 1
iris_directory_space{id="HSLIB",dir="/usr/irissys/mgr/hslib/"} 53818
iris_directory_space{id="HSSYS",dir="/usr/irissys/mgr/hssys/"} 53818
iris_directory_space{id="ENSLIB",dir="/usr/irissys/mgr/enslib/"} 53818
iris_directory_space{id="IRISSYS",dir="/usr/irissys/mgr/"} 53818
iris_directory_space{id="HSCUSTOM",dir="/usr/irissys/mgr/HSCUSTOM/"} 53818
iris_directory_space{id="IRISTEMP",dir="/usr/irissys/mgr/iristemp/"} 53818
iris_directory_space{id="IRISAUDIT",dir="/usr/irissys/mgr/irisaudit/"} 53818
iris_disk_percent_full{id="HSLIB",dir="/usr/irissys/mgr/hslib/"} 10.03
iris_disk_percent_full{id="HSSYS",dir="/usr/irissys/mgr/hssys/"} 10.03
iris_disk_percent_full{id="ENSLIB",dir="/usr/irissys/mgr/enslib/"} 10.03
iris_disk_percent_full{id="IRISSYS",dir="/usr/irissys/mgr/"} 10.03
iris_disk_percent_full{id="HSCUSTOM",dir="/usr/irissys/mgr/HSCUSTOM/"} 10.03
iris_disk_percent_full{id="IRISTEMP",dir="/usr/irissys/mgr/iristemp/"} 10.03
iris_disk_percent_full{id="IRISAUDIT",dir="/usr/irissys/mgr/irisaudit/"} 10.03
iris_ecp_conn 0
iris_ecp_conn_max 2
iris_ecp_connections 0
iris_ecp_latency 0
iris_ecps_conn 0
iris_ecps_conn_max 1
iris_glo_a_seize_per_sec 0
iris_glo_n_seize_per_sec 0
iris_glo_ref_per_sec 7
iris_glo_ref_rem_per_sec 0
iris_glo_seize_per_sec 0
iris_glo_update_per_sec 2
iris_glo_update_rem_per_sec 0
iris_journal_size 2496
iris_journal_space 50751.18
iris_jrn_block_per_sec 0
iris_jrn_entry_per_sec 0
iris_jrn_free_space{id="WIJ",dir="default"} 50751.18
iris_jrn_free_space{id="primary",dir="/usr/irissys/mgr/journal/"} 50751.18
iris_jrn_free_space{id="secondary",dir="/usr/irissys/mgr/journal/"} 50751.18
iris_jrn_size{id="WIJ"} 100
iris_jrn_size{id="primary"} 2
iris_jrn_size{id="secondary"} 0
iris_license_available 31
iris_license_consumed 1
iris_license_percent_used 3
iris_log_reads_per_sec 5
iris_obj_a_seize_per_sec 0
iris_obj_del_per_sec 0
iris_obj_hit_per_sec 2
iris_obj_load_per_sec 0
iris_obj_miss_per_sec 0
iris_obj_new_per_sec 0
iris_obj_seize_per_sec 0
iris_page_space_per_cent_used 0
iris_phys_mem_per_cent_used 95
iris_phys_reads_per_sec 0
iris_phys_writes_per_sec 0
iris_process_count 29
iris_rtn_a_seize_per_sec 0
iris_rtn_call_local_per_sec 10
iris_rtn_call_miss_per_sec 0
iris_rtn_call_remote_per_sec 0
iris_rtn_load_per_sec 0
iris_rtn_load_rem_per_sec 0
iris_rtn_seize_per_sec 0
iris_sam_get_db_sensors_seconds .000838
iris_sam_get_jrn_sensors_seconds .001024
iris_system_alerts 0
iris_system_alerts_new 0
iris_system_state 0
iris_trans_open_count 0
iris_trans_open_secs 0
iris_trans_open_secs_max 0
iris_wd_buffer_redirty 0
iris_wd_buffer_write 0
iris_wd_cycle_time 0
iris_wd_proc_in_global 0
iris_wd_size_write 0
iris_wd_sleep 10002
iris_wd_temp_queue 42
iris_wd_temp_write 0
iris_wdwij_time 0
iris_wd_write_time 0
iris_wij_writes_per_sec 0
Hi Developers,
Enjoy watching the new video on InterSystems Developers YouTube:
⏯ The Data Architecture that Leaves You Glueless @ Global Summit 2022
** Revised Feb-12, 2018
While this article is about InterSystems IRIS, it also applies to Caché, Ensemble, and HealthShare distributions.
Introduction
Memory is managed in pages. The default page size is 4KB on Linux systems. Red Hat Enterprise Linux 6, SUSE Linux Enterprise Server 11, and Oracle Linux 6 introduced a method to provide an increased page size in 2MB or 1GB sizes depending on system configuration know as HugePages.
At first HugePages required to be assigned at boot time, and if not managed or calculated appropriately could result in wasted resources. As a result various Linux distributions introduced Transparent HugePages with the 2.6.38 kernel as enabled by default. This was meant as a means to automate creating, managing, and using HugePages. Prior kernel versions may have this feature as well however may not be marked as [always] and potentially set to [madvise].
Transparent Huge Pages (THP) is a Linux memory management system that reduces the overhead of Translation Lookaside Buffer (TLB) lookups on machines with large amounts of memory by using larger memory pages. However in current Linux releases THP can only map individual process heap and stack space.
Author: Sergey Lukyanchikov, InterSystems
For one major reason: to avoid progressive technical and economic performance deterioration in an AIaaS setup characterized by increasing volume, velocity and variety of data flows (the famous Big Data’s “3 Vs”).
Hi All,
I have a method like this and I want to be able to see the results on the terminal, how do I run this method on a terminal to display the results of this SQL query?
Hi team,
I'll start with an apology as I am trying to wrap my head around the architecture of how InterSystems IRIS database management works. I am attempting to connect to the platform remotely through say a JDBC or ODBC connection in order to run queries, searches (through SQL statements) on my laptop and was trying to understand whether this would be possible? It is possible to setup an inbound client connection and wanted to better understand the architecture of how the database association works for IRIS database management. Does it use it's own internal SQL database or are we able to connect to our own database and which databases are certified to run against the platform?
Your application is deployed and everything is running fine. Great, hi-five! Then out of the blue the phone starts to ring off the hook – it’s users complaining that the application is sometimes ‘slow’. But what does that mean? Sometimes? What tools do you have and what statistics should you be looking at to find and resolve this slowness? Is your system infrastructure up to the task of the user load? What infrastructure design questions should you have asked before you went into production? How can you capacity plan for new hardware with confidence and without over-spec'ing? How can you stop the phone ringing? How could you have stopped it ringing in the first place?
In previous posts I have shown how it is possible to collect historical performance metrics using pButtons. I go to pButtons first because I know it is installed with every Data Platforms instance (Ensemble, Caché, …). However there are other ways to collect, process and display Caché performance metrics in real time either for simple monitoring or more importantly for much more sophisticated operational analytics and capacity planning. One of the most common methods of data collection is to use SNMP (Simple Network Management Protocol).
SNMP a standard way for Caché to provide management and monitoring information to a wide variety of management tools. The Caché online documentation includes details of the interface between Caché and SNMP. While SNMP should 'just work' with Caché there are some configuration tricks and traps. It took me quite a few false starts and help from other folks here at InterSystems to get Caché to talk to the Operating System SNMP master agent, so I have written this post so you can avoid the same pain.
In this post I will walk through the set up and configuration of SNMP for Caché on Red Hat Linux, you should be able to use the same steps for other *nix flavours. I am writing the post using Red Hat because Linux can be a little more tricky to set up - on Windows Caché automatically installs a DLL to connect with the standard Windows SNMP service so should be easier to configure.
Once SNMP is set up on the server side you can start monitoring using any number of tools. I will show monitoring using the popular PRTG tool but there are many others - Here is a partial list.
Note the Caché and Ensemble MIB files are included in the Caché_installation_directory/SNMP folder, the file are: ISC-CACHE.mib and ISC-ENSEMBLE.mib.
Start by reviewing Monitoring Caché Using SNMP in the Caché online documentation.
Follow the steps in Managing SNMP in Caché section in the Caché online documentation to enable the Caché monitoring service and configure the Caché SNMP subagent to start automatically at Caché startup.
Check that the Caché process is running, for example look on the process list or at the OS:
ps -ef | grep SNMP
root      1171  1097  0 02:26 pts/1    00:00:00 grep SNMP
root     27833     1  0 00:34 pts/0    00:00:05 cache -s/db/trak/hs2015/mgr -cj -p33 JOB^SNMP
Thats all, Caché configuration is done!
There is a little more to do here. First check that the snmpd daemon is installed and running. If not then install and start snmpd.
Check snmpd status with:
service snmpd status
Start or Stop snmpd with:
service snmpd start|stop
If snmp is not installed then you will have to install as per OS instructions, for example:
yum -y install net-snmp net-snmp-utils
As detailed in the Caché documentation, on Linux systems the most important task is to verify that the SNMP master agent on the system is compatible with the Agent Extensibility (AgentX) protocol (Caché runs as a subagent) and the master is active and listening for connections on the standard AgentX TCP port 705.
This is where I ran into problems. I made some basic errors in the snmp.conf file that meant the Caché SNMP subagent was not communicating with the OS master agent. The following sample /etc/snmp/snmp.conf file has been configured to start agentX and provide access to the Caché and ensemble SNMP MIBs.
Note you will have to confirm whether the following configuration complies with your organisations security policies.
At a minimum the following lines must be edited to reflect your system set up.
For example change:
syslocation "System_Location"
to
syslocation "Primary Server Room"
Also edit the at least the following two lines:
syscontact  "Your Name"
trapsink  Caché_database_server_name_or_ip_address public
Edit or replace the existing /etc/snmp/snmp.conf file to match the following:
###############################################################################
#
# snmpd.conf:
#   An example configuration file for configuring the NET-SNMP agent with Cache.
#
#   This has been used successfully on Red Hat Enterprise Linux and running
#   the snmpd daemon in the foreground with the following command:
#
#	/usr/sbin/snmpd -f -L -x TCP:localhost:705 -c./snmpd.conf
#
#   You may want/need to change some of the information, especially the
#   IP address of the trap receiver of you expect to get traps. I've also seen
#   one case (on AIX) where we had to use  the "-C" option on the snmpd command
#   line, to make sure we were getting the correct snmpd.conf file.
#
###############################################################################

###########################################################################
# SECTION: System Information Setup
#
#   This section defines some of the information reported in
#   the "system" mib group in the mibII tree.

# syslocation: The [typically physical] location of the system.
#   Note that setting this value here means that when trying to
#   perform an snmp SET operation to the sysLocation.0 variable will make
#   the agent return the "notWritable" error code.  IE, including
#   this token in the snmpd.conf file will disable write access to
#   the variable.
#   arguments:  location_string

syslocation  "System Location"

# syscontact: The contact information for the administrator
#   Note that setting this value here means that when trying to
#   perform an snmp SET operation to the sysContact.0 variable will make
#   the agent return the "notWritable" error code.  IE, including
#   this token in the snmpd.conf file will disable write access to
#   the variable.
#   arguments:  contact_string

syscontact  "Your Name"

# sysservices: The proper value for the sysServices object.
#   arguments:  sysservices_number

sysservices 76

###########################################################################
# SECTION: Agent Operating Mode
#
#   This section defines how the agent will operate when it
#   is running.

# master: Should the agent operate as a master agent or not.
#   Currently, the only supported master agent type for this token
#   is "agentx".
#
#   arguments: (on|yes|agentx|all|off|no)

master agentx
agentXSocket tcp:localhost:705

###########################################################################
# SECTION: Trap Destinations
#
#   Here we define who the agent will send traps to.

# trapsink: A SNMPv1 trap receiver
#   arguments: host [community] [portnum]

trapsink  Caché_database_server_name_or_ip_address public

###############################################################################
# Access Control
###############################################################################

# As shipped, the snmpd demon will only respond to queries on the
# system mib group until this file is replaced or modified for
# security purposes.  Examples are shown below about how to increase the
# level of access.
#
# By far, the most common question I get about the agent is "why won't
# it work?", when really it should be "how do I configure the agent to
# allow me to access it?"
#
# By default, the agent responds to the "public" community for read
# only access, if run out of the box without any configuration file in
# place.  The following examples show you other ways of configuring
# the agent so that you can change the community names, and give
# yourself write access to the mib tree as well.
#
# For more information, read the FAQ as well as the snmpd.conf(5)
# manual page.
#
####
# First, map the community name "public" into a "security name"

#       sec.name  source          community
com2sec notConfigUser  default       public

####
# Second, map the security name into a group name:

#       groupName      securityModel securityName
group   notConfigGroup v1           notConfigUser
group   notConfigGroup v2c           notConfigUser

####
# Third, create a view for us to let the group have rights to:

# Make at least  snmpwalk -v 1 localhost -c public system fast again.
#       name           incl/excl     subtree         mask(optional)
# access to 'internet' subtree
view    systemview    included   .1.3.6.1

# access to Cache MIBs Caché and Ensemble
view    systemview    included   .1.3.6.1.4.1.16563.1
view    systemview    included   .1.3.6.1.4.1.16563.2
####
# Finally, grant the group read-only access to the systemview view.

#       group          context sec.model sec.level prefix read   write  notif
access  notConfigGroup ""      any       noauth    exact  systemview none none
After editing the /etc/snmp/snmp.conf file restart the snmpd deamon.
service snmpd restart
Check the snmpd status, note that AgentX has been started see the status line: Turning on AgentX master support.
h-4.2# service snmpd restart
Redirecting to /bin/systemctl restart  snmpd.service
sh-4.2# service snmpd status
Redirecting to /bin/systemctl status  snmpd.service
● snmpd.service - Simple Network Management Protocol (SNMP) Daemon.
   Loaded: loaded (/usr/lib/systemd/system/snmpd.service; disabled; vendor preset: disabled)
   Active: active (running) since Wed 2016-04-27 00:31:36 EDT; 7s ago
 Main PID: 27820 (snmpd)
   CGroup: /system.slice/snmpd.service
		   └─27820 /usr/sbin/snmpd -LS0-6d -f

Apr 27 00:31:36 vsan-tc-db2.iscinternal.com systemd[1]: Starting Simple Network Management Protocol (SNMP) Daemon....
Apr 27 00:31:36 vsan-tc-db2.iscinternal.com snmpd[27820]: Turning on AgentX master support.
Apr 27 00:31:36 vsan-tc-db2.iscinternal.com snmpd[27820]: NET-SNMP version 5.7.2
Apr 27 00:31:36 vsan-tc-db2.iscinternal.com systemd[1]: Started Simple Network Management Protocol (SNMP) Daemon..
sh-4.2#
After restarting snmpd you must restart the Caché SNMP subagent using the ^SNMP routine:
%SYS>do stop^SNMP()

%SYS>do start^SNMP(705,20)
The operating system snmpd daemon and Caché subagent should now be running and accessible.
MIB access can be checked from the command line with the following commands. snmpget returns a single value:
snmpget -mAll -v 2c -c public vsan-tc-db2 .1.3.6.1.4.1.16563.1.1.1.1.5.5.72.50.48.49.53

SNMPv2-SMI::enterprises.16563.1.1.1.1.5.5.72.50.48.49.53 = STRING: "Cache for UNIX (Red Hat Enterprise Linux for x86-64) 2015.2.1 (Build 705U) Mon Aug 31 2015 16:53:38 EDT"
And snmpwalk will 'walk' the MIB tree or branch:
snmpwalk -m ALL -v 2c -c public vsan-tc-db2 .1.3.6.1.4.1.16563.1.1.1.1

SNMPv2-SMI::enterprises.16563.1.1.1.1.2.5.72.50.48.49.53 = STRING: "H2015"
SNMPv2-SMI::enterprises.16563.1.1.1.1.3.5.72.50.48.49.53 = STRING: "/db/trak/hs2015/cache.cpf"
SNMPv2-SMI::enterprises.16563.1.1.1.1.4.5.72.50.48.49.53 = STRING: "/db/trak/hs2015/mgr/"
etc
etc
There are also several windows and *nix clients available for viewing system data. I use the free iReasoning MIB Browser. You will have to load the ISC-CACHE.MIB file into the client so it knows the structure of the MIB.
The following image shows the iReasoning MIB Browser on OSX.
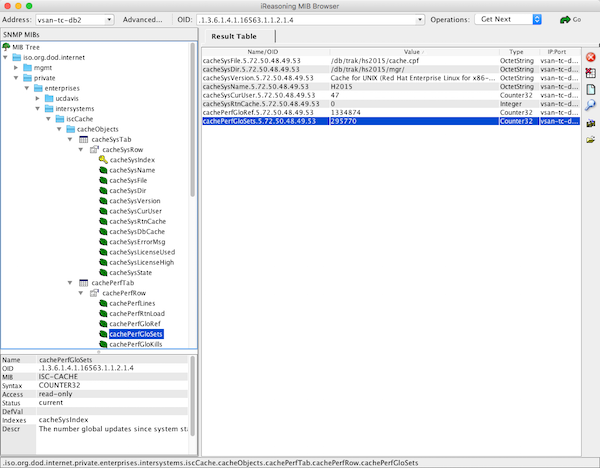
This is where there can be wide differences in implementation. The choice of monitoring or analytics tool I will leave up to you.
Please leave comments to the post detailing the tools and value you get from them for monitoring and managing your systems. This will be a big help for other community members.
Below is a screen shot from the popular PRTG Network Monitor showing Caché metrics. The steps to include Caché metrics in PRTG are similar to other tools.
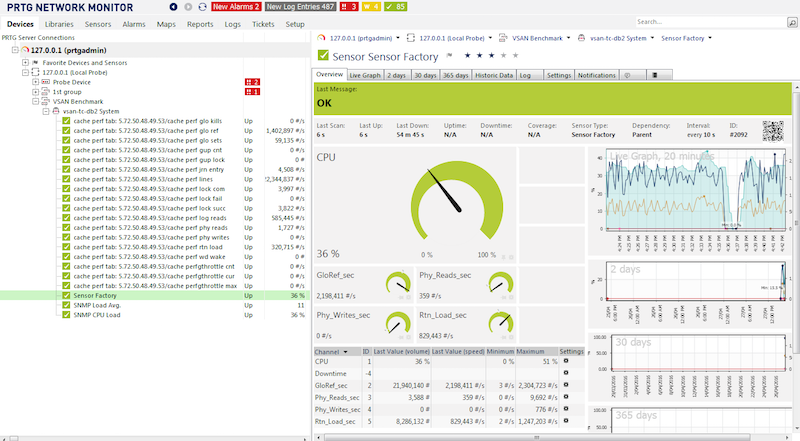
Make sure you can connect to the operating system MIBs. A tip is to do your trouble-shooting against the operating system not Caché. It is most likely that monitoring tools already know about and are preconfigured for common operating system MIBs so help form vendors or other users may be easier.
Depending on the monitoring tool you choose you may have to add an SNMP 'module' or 'application', these are generally free or open source. I found the vendor instructions pretty straight forward for this step.
Once you are monitoring the operating system metrics its time to add Caché.
Import the ISC-CACHE.mib and ISC-ENSEMBLE.mib into the tool so that it knows the MIB structure.
The steps here will vary; for example PRTG has a 'MIB Importer' utility. The basic steps are to open the text file ISC-CACHE.mib in the tool and import it to the tools internal format. For example Splunk uses a Python format, etc.
Note: I found the PRTG tool timed out if I tried to add a sensor with all the Caché MIB branches. I assume it was walking the whole tree and timed out for some metrics like process lists, I did not spend time troubleshooting this, instead I worked around this problem by only importing the performance branch (cachePerfTab) from the ISC-CACHE.mib.
Once imported/converted the MIB can be reused to collect data from other servers in your network. The above graphic shows PRTG using Sensor Factory sensor to combine multiple sensors into one chart.
There are many monitoring, alerting and some very smart analytics tools available, some free, others with licences for support and many and varied functionality.
You must monitor your system and understand what activity is normal, and what activity falls outside normal and must be investigated. SNMP is a simple way to expose Caché and Ensemble metrics.
Hi guys, I am not able to load the file codes on the terminology registry, do you know how the structure should look like when uploading terminology codes file under Registry namespace
Below is the error I am getting the below error
Myself and the other Technology Architects often have to explain to customers and vendors Caché IO requirements and the way that Caché applications will use storage systems. The following tables are useful when explaining typical Caché IO profile and requirements for a transactional database application with customers and vendors. The original tables were created by Mark Bolinsky.
In future posts I will be discussing more about storage IO so am also posting these tables now as a reference for those articles.