Does InterSystems IRIS has a MEDIAN (or percentile) calculation in SQL?
This tag relates to the discussions on the development of analytics and business intelligence solutions, visualization, KPI and other business metrics management.
This tag relates to the discussions on the development of analytics and business intelligence solutions, visualization, KPI and other business metrics management.
Does InterSystems IRIS has a MEDIAN (or percentile) calculation in SQL?
Hi Community,
In this article, I will introduce my application iris-DataViz
iris-DataViz is an Exploratory Data Analysis and Visualization Streamlit Application that leverages the functionality of IRIS embedded python and SQLAlchemy to interact with IRIS, as well as the PyGWalker python library for data analysis and data Visualization. PyGWalker (Python Graphic Walker) is an interactive data visualization library built for Python, aiming to bring the ease and functionality of Tableau-style drag-and-drop visualization into Python environments.
I am excited to share that the Learning Services team has recently added new content to our InterSystems Reports Learning Path. These latest videos, created by our partner, insightsoftware, provide instruction for developing reports with InterSystems Report Designer.
In these three short videos, you’ll learn how to:
In today's data landscape, businesses encounter a number of different challenges. One of them is to do analytics on top of unified and harmonized data layer available to all the consumers. A layer that can deliver the same answers to the same questions irrelative to the dialect or tool being used. InterSystems IRIS Data Platform answers that with and add-on of Adaptive Analytics that can deliver this unified semantic layer. There are a lot of articles in DevCommunity about using it via BI tools. This article will cover the part of how to consume it with AI and also how to put some insights back. Let's go step by step...
You can easily find some definition in developer community website In a few words, it can deliver data in structured and harmonized form to various tools of your choice for further consumption and analysis. It delivers the same data structures to various BI tools. But... it can also deliver same data structures to your AI/ML tools!
Adaptive Analytics has and additional component called AI-Link that builds this bridge from AI to BI.
It is a Python component that is designed to enable programmatic interaction with the semantic layer for the purposes of streamlining key stages of the machine learning (ML) workflow (for example, feature engineering).
With AI-Link you can:
As this is a Python library, it can be used in any Python environment. Including Notebooks. And in this article I'll give a simple example of reaching Adaptive Analytics solution from Jupyter Notebook with the help of AI-Link.
Here is git repository which will have the complete Notebook as example: https://github.com/v23ent/aa-hands-on
Further steps assume that you have the following pre-requisites completed:
First, let's install needed components in our environment. That will download a few packages needed for further steps to work. 'atscale' - this is our main package to connect 'prophet' - package that we'll need to do predictions
pip install atscale prophet
Then we'll need to import key classes representing some key concepts of our semantic layer. Client - class that we'll use to establich a connection to Adaptive Analytics; Project - class to represent projects inside Adaptive Analytics; DataModel - class that will represent our virtual cube;
from atscale.client import Client
from atscale.data_model import DataModel
from atscale.project import Project
from prophet import Prophet
import pandas as pd
Now we should be all set to establish a connection to our source of data.
client = Client(server='http://adaptive.analytics.server', username='sample')
client.connect()
Go ahead and specify connection details of your Adaptive Analytics instance. Once you're asked for the organization respond in the dialog box and then please enter your password from the AtScale instance.
With established connection you'll then need to select your project from the list of projects published on the server. You'll get the list of projects as an interactive prompt and the answer should be the integer ID of the project. And then data model is selected automatically if it's the only one.
project = client.select_project()
data_model = project.select_data_model()
There are a number of methods prepared by AtScale in AI-Link component library. They allow to explore data catalog that you have, query data, and even ingest some data back. AtScale documentation has extensive API reference describing everything that is available. Let's first see what is our dataset by calling few methods of data_model:
data_model.get_features()
data_model.get_all_categorical_feature_names()
data_model.get_all_numeric_feature_names()
The output should look something like this

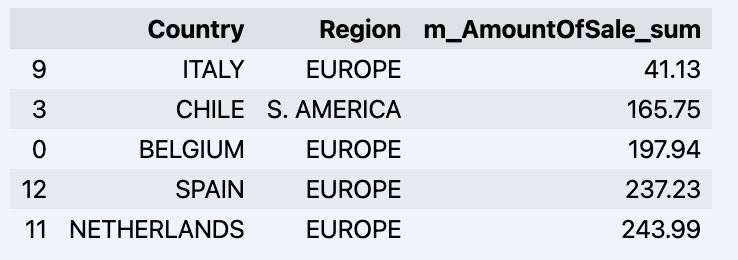
Once we've looked around a bit, we can query the actual data we're interested in using 'get_data' method. It will return back a pandas DataFrame containing the query results.
df = data_model.get_data(feature_list = ['Country','Region','m_AmountOfSale_sum'])
df = df.sort_values(by='m_AmountOfSale_sum')
df.head()
Which will show your datadrame:
Let's prepare some dataset and quickly show it on the graph
import matplotlib.pyplot as plt

# We're taking sales for each date
dataframe = data_model.get_data(feature_list = ['Date','m_AmountOfSale_sum'])

# Create a line chart
plt.plot(dataframe['Date'], dataframe['m_AmountOfSale_sum'])

# Add labels and a title
plt.xlabel('Days')
plt.ylabel('Sales')
plt.title('Daily Sales Data')

# Display the chart
plt.show()
Output:

The next step would be to actually get some value out of AI-Link bridge - let's do some simple prediction!
# Load the historical data to train the model
data_train = data_model.get_data(
    feature_list = ['Date','m_AmountOfSale_sum'],
    filter_less = {'Date':'2021-01-01'}
    )
data_test = data_model.get_data(
    feature_list = ['Date','m_AmountOfSale_sum'],
    filter_greater = {'Date':'2021-01-01'}
    )
We get 2 different datasets here: to train our model and to test it.
# For the tool we've chosen to do the prediction 'Prophet', we'll need to specify 2 columns: 'ds' and 'y'
data_train['ds'] = pd.to_datetime(data_train['Date'])
data_train.rename(columns={'m_AmountOfSale_sum': 'y'}, inplace=True)
data_test['ds'] = pd.to_datetime(data_test['Date'])
data_test.rename(columns={'m_AmountOfSale_sum': 'y'}, inplace=True)

# Initialize and fit the Prophet model
model = Prophet()
model.fit(data_train)
And then we create another dataframe to accomodate our prediction and display it on the graph
# Create a future dataframe for forecasting
future = pd.DataFrame()
future['ds'] = pd.date_range(start='2021-01-01', end='2021-12-31', freq='D')

# Make predictions
forecast = model.predict(future)
fig = model.plot(forecast)
fig.show()
Output:
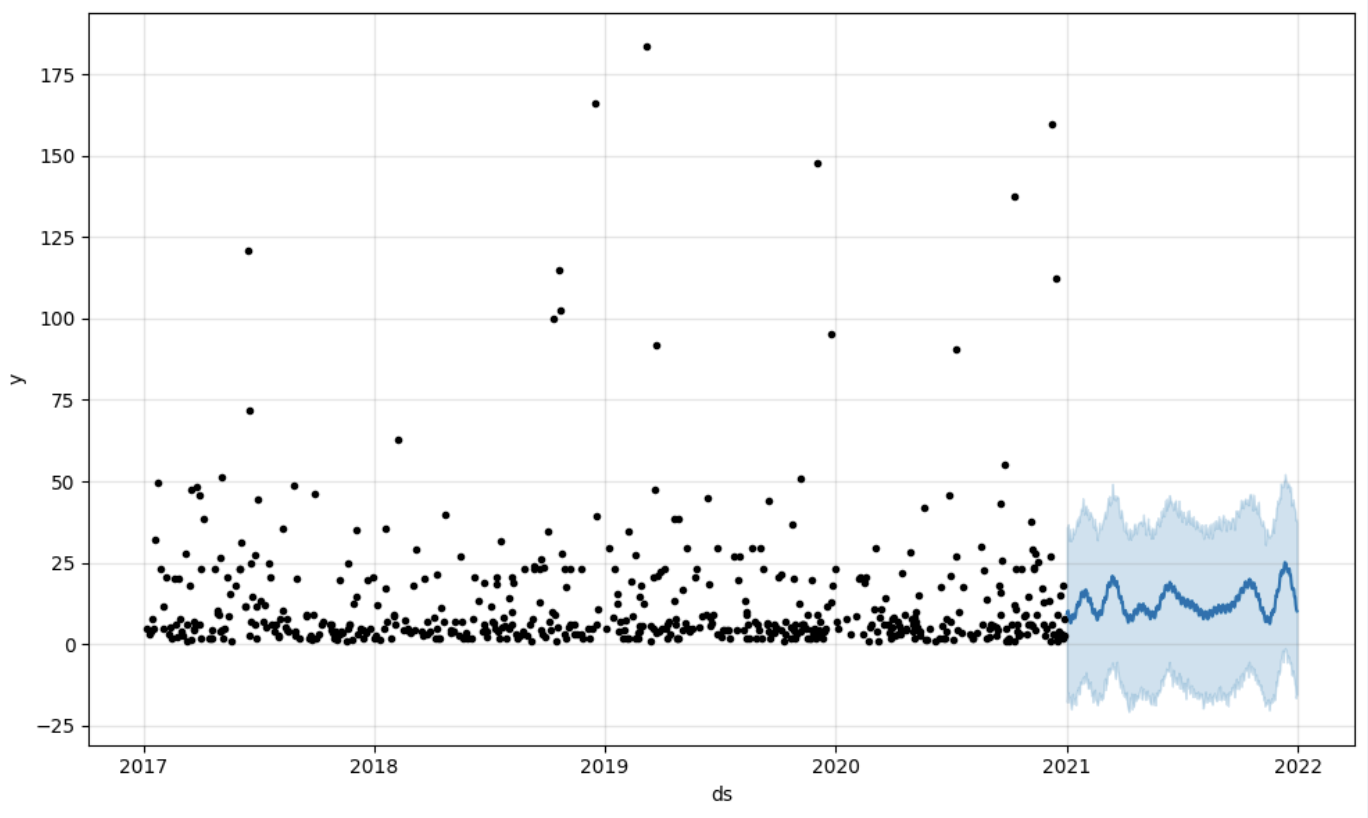
Once we've got our prediction in place we can then put it back to the data warehouse and add an aggregate to our semantic model to reflect it for other consumers. The prediction would be available through any other BI tool for BI analysts and business users. The prediction itself will be placed into our data warehouse and stored there.
from atscale.db.connections import Iris
db = Iris(
    username,
    host,
    namespace,
    driver,
    schema,
    port=1972,
    password=None,
    warehouse_id=None
    )

data_model.writeback(dbconn=db,
                    table_name= 'SalesPrediction',
                    DataFrame = forecast)

data_model.create_aggregate_feature(dataset_name='SalesPrediction',
                                    column_name='SalesForecasted',
                                    name='sum_sales_forecasted',
                                    aggregation_type='SUM')
That is it! Good luck with your predictions!
The invention and popularization of Large Language Models (such as OpenAI's GPT-4) has launched a wave of innovative solutions that can leverage large volumes of unstructured data that was impractical or even impossible to process manually until recently. Such applications may include data retrieval (see Don Woodlock's ML301 course for a great intro to Retrieval Augmented Generation), sentiment analysis, and even fully-autonomous AI agents, just to name a few!
My team and I noticed that the %ZEN class documentation labeled all properties and methods as deprecated.
In this regard, the big question is: what will be used to replace these methods, in particular %ZEN.Auxiliary.altJSONProvider?
It is used as the basis for the MDX2JSON package, from which DeepSeeWeb gets data to build Analytical Dashboards.
Is a replacement proposed for deprecated methods of %ZEN class?
And when is this functionality scheduled to be permanently disabled?
TL;DR: My comment to Microsoft when I voted:Our team has implemented most of what we need for source management of Power BI Report files in Perforce. The missing piece? Automated creation of ".pbix" files from ".pbit" template files that can deployed to the Power BI Report Server. Let's get the manual “Power BI Desktop->File->Save As” step out of the process to make report deployment totally automated.
Hi Everyone,
We are using SQL based KPI's to display reports in IRIS dashboards. We have applied the filter functionality in these SQL based KPI reports.
I need your help for below scenario.
Below is my full report. Filter is applied on Name and Subject Name in this report.
Now I have used filter on Name and selected values 'Virat' and 'Big Show'
2 entries were displayed from 5 records.
Now when I look in Subject Name Filter, it still display all the distinct values of Subject Name.
I want this to display only Chemistry and Social (as Name filter got applied).
Hello everyone,
I am working with InterSystems IRIS and seeking guidance on how to perform specific tasks related to the FHIR SQL Builder using commands or code, rather than the graphical user interface (GUI). The specific tasks I am trying to accomplish are:
Hi Community,
Dive into the new video on InterSystems Developers YouTube:
⏯ Near Real-Time Analytics with InterSystems IRIS & Debezium Change Data Capture @ Global Summit 2023
Hi Community,
Play the new video on InterSystems Developers YouTube:
⏯ InterSystems IRIS Business Intelligence - Tips & Tricks @ Global Summit 2023
A few months ago, I faced a significant challenge: streamlining the handling of business logic in our application. My goal was to extract the business logic from the code and hand it over to analysts. Dealing with a multitude of rules could easily result in a code littered with countless "if" statements, especially if the coder lacked an understanding of cyclomatic complexity. Such code becomes a source of pain for those working with it—difficult to write, test, and develop.
Hi Community,
I hope this message finds you well. I am reaching out because I have encountered an issue with a new dimension I created, named "Region," and I could use your assistance in resolving it.
The problem is that when I open the cube analyzer, the "Region" dimension does not populate data as expected. Instead, it merely displays the text "sourceRegion," which I specified as an expression in the architect.
Hi Developers,
Watch this video to learn about some recent machine learning engagements InterSystems is driving, including TrakCare predictive analytics and examples from our Developer Community and partners:
⏯ Artificial Intelligence Healthcare Solutions - Time to Take Action @ Global Summit 2023
Hey Community,
Click play and immerse yourself in our fresh video on InterSystems Developers YouTube:
⏯ Adaptive Analytics in Action - Two Customer Use Cases @ Global Summit 2023
We recently published a new White Paper on the use of reporting nodes ("asynchronous reporting mirror members" in full) in a mirrored environment. More and more customers are looking into this mechanism as a quick and easy way to set up a copy of their production data that stays current, yet can be used for analytical querying or heavy-duty reporting workloads without impacting the source system. Read the White Paper here.
Creating information dashboards, pivot tables, and widgets is an important step in analysis that provides valuable sources of information for informed decision-making. The IRIS BI platform offers many opportunities to create and customize these elements. In this article, we will take a closer look at the basic techniques for developing them and the importance of using them.
Dashboards are visual tools that combine different data in one interface for more effective monitoring and analysis. Creating a dashboard on the IRIS BI platform involves several key steps:
Hi Community,
We're excited to share with you the recording of the next webinar in the series of InterSystems UKI Tech Talk:
👉 Analytics Capabilities using InterSystems IRIS 👈
.png)
Hello community, I need to solve a complex but trivial issue.
Given:
Two tables "Comment" and "Post". Each one contains an "Author" field, which is essentially a user ID. In these tables, each user ID represents an author. The goal is to count all participants together and then group them by month, language, and other metrics.
The question is how to do this within the IRIS ecosystem. Is it even possible to take two tables, get distinct data from them and then combine into one cube?
When analyzing data, there is often a need to look at specific indicators more thoroughly and to highlight sections of information of particular interest to a user.
For instance, examining the data dynamics for specific regions or dates can help us uncover some hidden trends and patterns that will allow us to make an informed decision about our project in the future.
Hello Community,
Anyone who has (near or distant, with a preference for the 1st option) knowledge of the use of Amazon QuickSight with IRIS is invited to share his|her experience in this discussion.
Thanking you in advance.
Hi developers,
We have received quite a lot of interest in using SQL on FHIR data. As you know, FHIR data is encoded in the form of a complex directed graph, and thus you can not easily query it with traditional SQL queries or business intelligence tools. Some customers have noticed that the "FHIR search tables" in IRIS for Health have flattened part of the FHIR graph, and have tried to use them for analytics. This is an undocumented and unsupported part of IRIS for Health, and can change without notice.
 |
How to include IRIS Data into your Google Big Query Data Warehouse and in your Data Studio data explorations. In this article we will be using Google Cloud Dataflow to connect to our InterSystems Cloud SQL Service and build a job to persist the results of an IRIS query in Big Query on an interval. If you were lucky enough to get access to Cloud SQL at Global Summit 2022 as mentioned in "InterSystems IRIS: What's New, What's Next", it makes the example a snap, but you can pull this off with any publicly or vpc accessible listener you have provisioned instead. |
As said in the previous article about the iris-fhir-generative-ai experiment, the project logs all events for analysis. Here we are going to discuss two types of analysis covered by analytics embedded in the project:
In order to extract useful data to apply analytics, we used the iknowpy library - an opensource library for Natural Language Processing based in the iKnow for IRIS Data Platform. It makes possible identifies entities (phrases) and their semantic context in natural language text in several languages.
Here it's used to extract concepts from data of each log. Check the method SaveConcepts() in the class LogConceptTable for more details.
So, we create a IRIS BI Cube for counting concepts and relate them with other dimensions, like log types and descriptions, for instance.
After you got some prompts answered, you are ready to build the cube. You can do this by accessing the cube manager and hit the Build button, or do it programatically:
ZN "USER"
Do ##class(%DeepSee.Utils).%BuildCube("LogAnalyticsCube")
With this cube, we create a dashboard which people can get insights about how the prompts are going in terms of what users are asking and if those prompts are beeing executed or not.
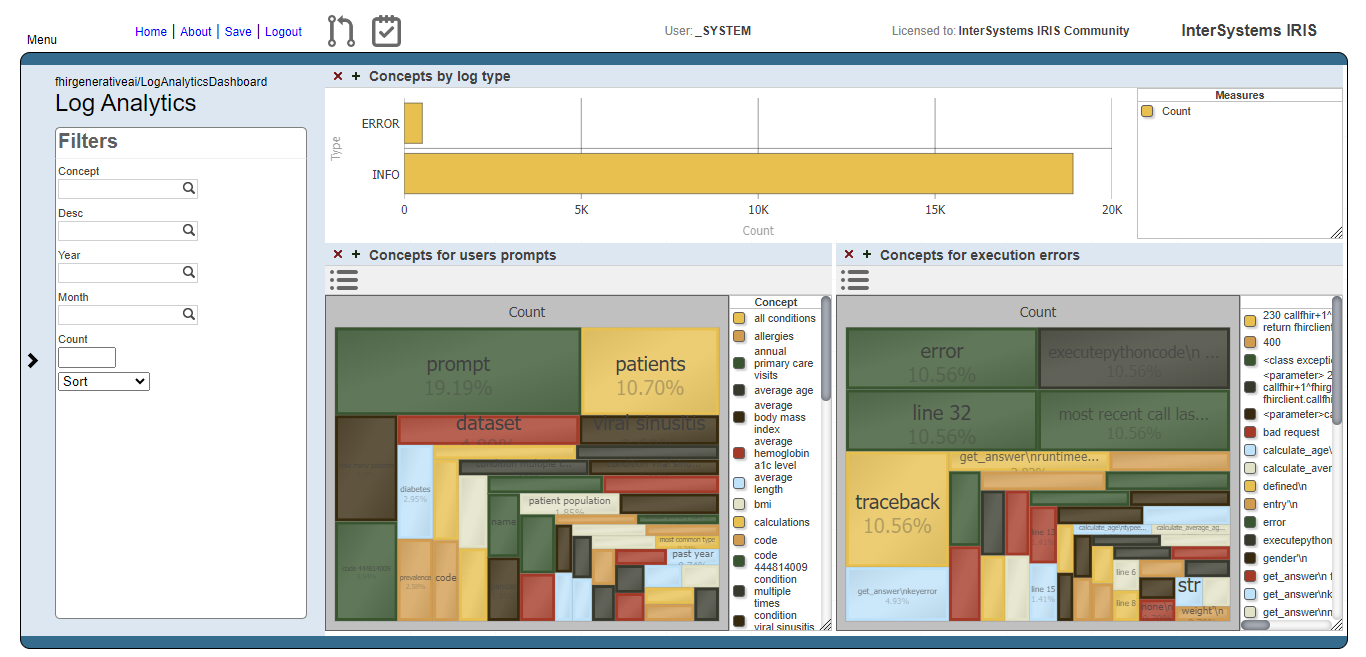
Fig.1 - Log Analytics Dashboard
The image below shows the result of the users prompts analysis after running the methods DoAccuracyTests and DoAccuracyExtendedSetTests() of the class fhirgenerativeai.Tests(). It uses a treemap to show the most prevelent concepts.

Fig.2 - Detail of users prompts
As you can see, the most prevelent concepts are meaningless concepts like prompt, code, dataset etc.
Let's exclude these concepts from the analysis:
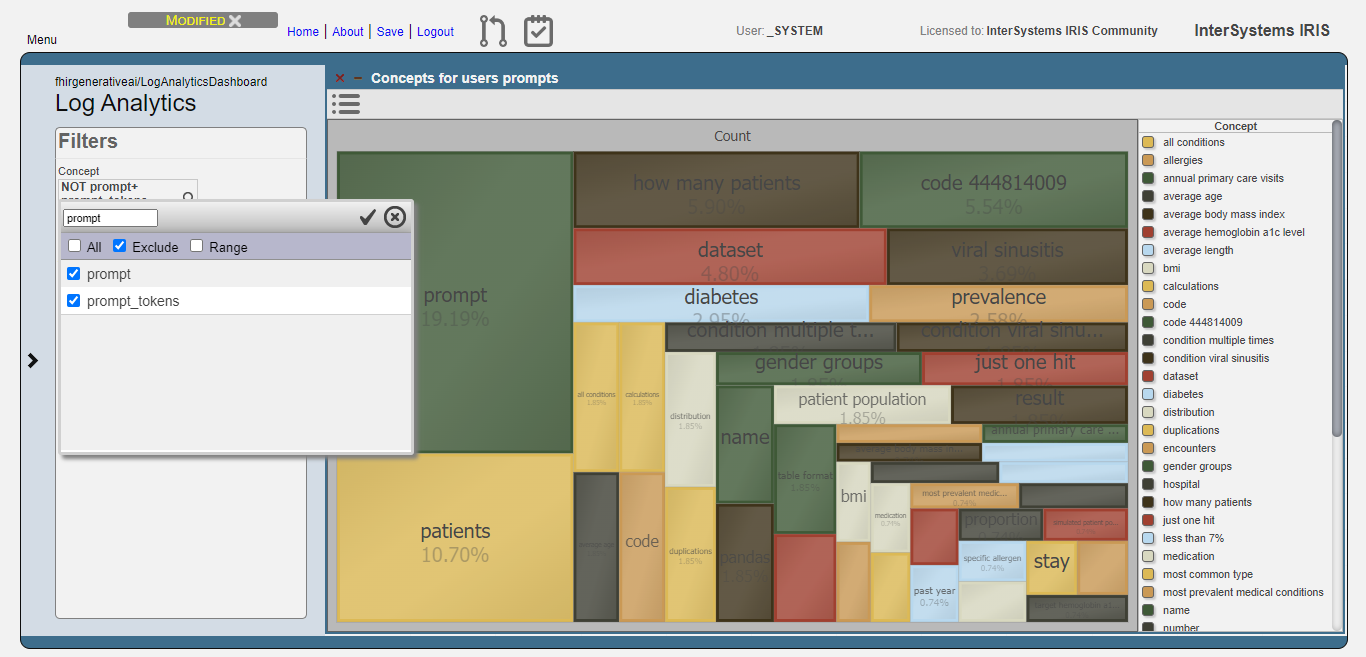
Fig.3 - Exclusion of meaningless concepts
Then, get the top 10 concepts:

Fig.4 - Top 10 concepts for users prompts
Now, we can see that users are asking questions rearging patients, and conditions like viral sinusitis and diabetes, for instance. This could lead system administrators to get insights about what users are expecting and proceed to attend such needs.
For the execution errors analysis, we have the same visualization as the users prompts. But now, displaying concepts related to execution errors.

Fig.5 - Details of execution errors
And like for the users prompts analysis, we exclude meaningless concepts and got just the top 10 concepts:
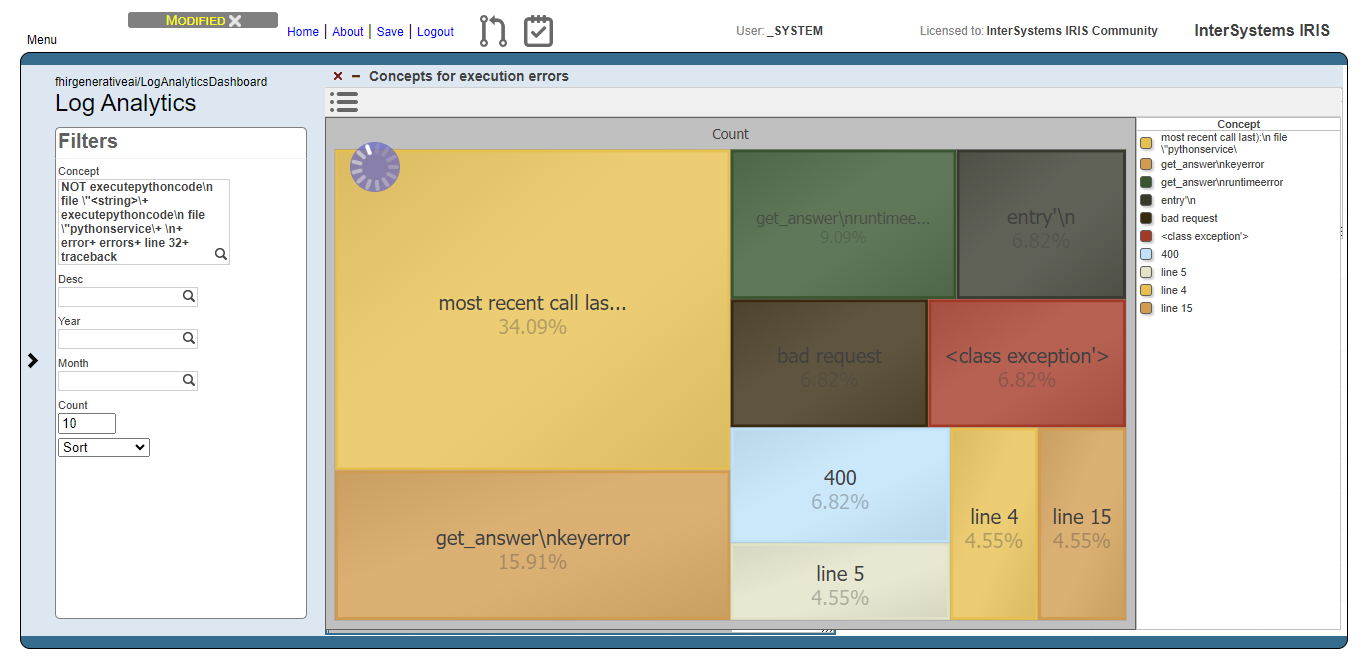
Fig.6 - Top 10 concepts for execution errors
Now we can note, for instance, that concepts like "bad request" and 400 (the HTTP code for bad request error) are relevant. This means that the AI model are generating code that tends to setting invalid FHIR requests.
A simple data analysis example created in IntegratedML and Dashboard
Based on InterSystems' Integrated ML technology and Dashboard, automatically generate relevant predictions and BI pages based on uploaded CSV files. The front and back ends are completed in Vue and Iris, allowing users to generate their desired data prediction and analysis pages with simple operations and make decisions based on them.
# ZPM installation
zpm:USER>install IntegratedMLandDashboardSample
# Process Deployment
Use or create a new namespace
Import code into the corresponding namespace
Execute in Terminal:
Hi Community,
Enjoy watching the new video on InterSystems Developers YouTube:
⏯ HealthShare Analytics Solution: So Many Tools, So Much Power @ Global Summit 2022
When I started this project I had set myself limits:
Though there is a wide range of almost ready-to-use modules in various languages
and though IRIS has excellent facilities and interfaces to make use of them
I decided to solve the challenge "totally internal" just with embedded Python, SQL, ObjectScript
Neither Java, nor Nodes, nor Angular, PEX, ... you name it.
The combination of embedded Python and SQL is preferred. ObjectScript is just my last chance.
Apache Superset is a modern data exploration and data visualization platform. Superset can replace or augment proprietary business intelligence tools for many teams. Superset integrates well with a variety of data sources.
And now it is possible to use with InterSystems IRIS as well.
An online demo is available and it uses IRIS Cloud SQL as a data source.
.png)
Our team has had success creating and publishing Power BI reports using an ODBC connection to an IRIS database, but there have been concerns about the responsiveness of these reports.
As an attempt to improve responsiveness, I'm trying out the "DirectQuery" connection using the InterSystems IRIS connector available in our version of Power BI Desktop (September 2021).
The version of IRIS I'm connecting with is "IRIS for Windows (x86-64) 2022.2"
With the improvement of living standards, people pay more and more attention to physical health. And the healthy development of children has become more and more a topic of concern for parents. The child's physical development can be reflected from the child's height and weight. Therefore, it is of great significance to predict the height and weight in a timely manner. Pay attention to the child's developmental state through scientific prediction and comparison.