#Analytics

0 Followers · 286 Posts

This tag relates to the discussions on the development of analytics and business intelligence solutions, visualization, KPI and other business metrics management.

Question Harkirat Dhillon · Oct 25, 2018

Hello, I need help in health insight. I am trying to generate reports on deep see but i am not able to pull in the patient ids as these are our requirements for the project. Can anyone help me in unlocking this feature. Can anyone help me with link to correct documentation on how to access the edge gateways of multiple facilities to access the clinical data on sql explorer.

3
0 508
Question Evgeny Shvarov · Nov 15, 2018

Hi All!

I asked previously about the DR server in the cloud but actually, I'm curious about the backup server to use as analytics server more than for recovery in DR case.

There is a recommended practice to use an async mirror as a server for BI (InterSystems Analytics, DeepSee)

The question is if I have PRIMARY in the cloud (AWS, Google, Azure, etc) "how far" should async mirror member be placed? Same cloud, same private cloud or it doesn't matter at all for analytics purposes?

3
0 394
Article Semion Makarov · Oct 22, 2018 7m read

Users of analytical applications often need to generate and send out PDF reports comprised of elements of the analytical panel. In the InterSystems stack, this task is solved using the DSW Reports project that is an extension of DeepSeeWeb. In this article, we will explain how to use DSW Reports for generating PDF reports and emailing them.

What is DSW Reports?

The InterSystems IRIS Business Intelligence (formerly known as DeepSee) is used for developing analytical applications and is a part of InterSystems IRIS Data Platform. There is a separate project called DeepSeeWeb that uses a more modern web interface (AngularJS) for visualizing analytical panels of InterSystems IRIS BI. To interact with the server side, DeepSeeWeb uses MDX2JSON, a project that provides REST API access to InterSystems IRIS BI.

DSW Reports is a DeepSeeWeb extension written in AngularJS that implements the key functionality for automatic report generation. DSW Reports uses DeepSeeWeb for rendering widgets and MDX2JSON for processing MDX requests.

Capabilities:

  • Rendering of selected widgets with predefined filters.
  • Output of execution results for arbitrary MSD requests.
  • Automatic printing and emailing of PDF reports.
  • Customization of reports via CSS

HTML-report

Report generation

In order to generate a report in DSW Reports, you need to create just two files:

  • index.html — the skeleton and the main page of the report, usually remains unchanged.
  • config.js — report configuration that is changed for different types of reports and is responsible for populating the report with data.

The report configuration file must contain the getConfiguration function.

// General report settings
function getConfiguration(params){...}

The getConfiguration function accepts a params object containing parameters from the URL and an additional "server" parameter that is the address of the server. The "server" parameter has the following form: protocol://host:port.

Thanks to the params object, you can pass any data to your report via the URL string. For instance, if you need to change widget filters to your liking, you can pass the “filter” parameter in the URL and it becomes accessible via the params object.

//<protocol://host:port>/dsw/reports/report_dir/index.html?filter=NOW
function getConfiguration(params){
    var filter = params["filter"]; // filter = "NOW"
}

The getConfiguration function returns an object with 3 properties:

  • REPORT_NAME — report name
  • BLOCKS — array of report blocks
  • NAMESPACE — namespace containing data for the report

Let’s take a closer look at an array of blocks called BLOCKS. A block is an object containing widget settings, settings of calculable fields, and so on.

Block view:


{
    "title": String,            //Block title
    "note": String,             //Notes under the block. Can contain HTML code
    "widget": {                 //Widget iframe settings:
        "url": String,          //URL of the iframe source
        "height": Number,       // iframe height
        "width": Number         // iframe width
    },
    "totals":[{                 //Settings of values calculated using MDX
        "mdx": String           //MDX request
        "strings": [{           //Value strings from the request
            "title": String,    //String title. Can use HTML.
            "value": String,    //Default string value
            "value_append": String, //Suffix for the value. 
                                //Can be used for %, $ and other symbols. 
                                //% converts the value in to a percentage (x * 100).
                                //Can use HTML.
            "row": Number       //Number of the row from the MDX request
                                //that the value is taken from. 
                                //The default value is 0.
     },{...}]
},{...}]}

All the fields are necessary. If you don’t need a field, better leave it as a blank row.

Block example
{
     title: "Persons",
     note: "",
     widget: {
        url: server + "/dsw/index.html#!/d/KHAB/Khabarovsk%20Map.dashboard" + 
        "?widget=1&height=420&ns=" + namespace,
        width: 700,
        height: 420
     }
}
Another example
{
    title: "Khabarovsky krai",
    note: "Something note (only static)",
    widget: {
        url: server + "/dsw/index.html#!/d/KHAB/Khabarovsk%20Map.dashboard" + 
        "?widget=0&height=420&isLegend=true&ns=" + namespace,
        width: 495,
        height: 420
    },
    totals: [{
       mdx: "SELECT NON EMPTY " + 
      "[Region].[H1].[Region].CurrentMember.Properties(\"Population\") ON 0,"+
      "NON EMPTY {[Region].[H1].[Region].&[Khabarovsk]," + 
      "[Region].[H1].[Region].&[Komsomolsk-on-Amur],"+
      "[Region].[H1].[Region].&[Komsomolsky district]} ON 1 FROM [KHABCUBE]",
       strings: [{
            title: "Khabarovsk: ",
            value: "None",
            value_append: " ppl"
        }, {
            title: "Komsomolsk-on-Amur: <br />",
            value: "None",
            value_append: " ppl",
            row: 1
        }, {
            title: "Komsomolsky district: <br />",
            value: "None",
            value_append: " ppl",
            row: 2
        }]
    }]
}

What do I fill a block with?

The main fields for filling out in a block are “url” for widget settings and “mdx” for the settings of calculable values.

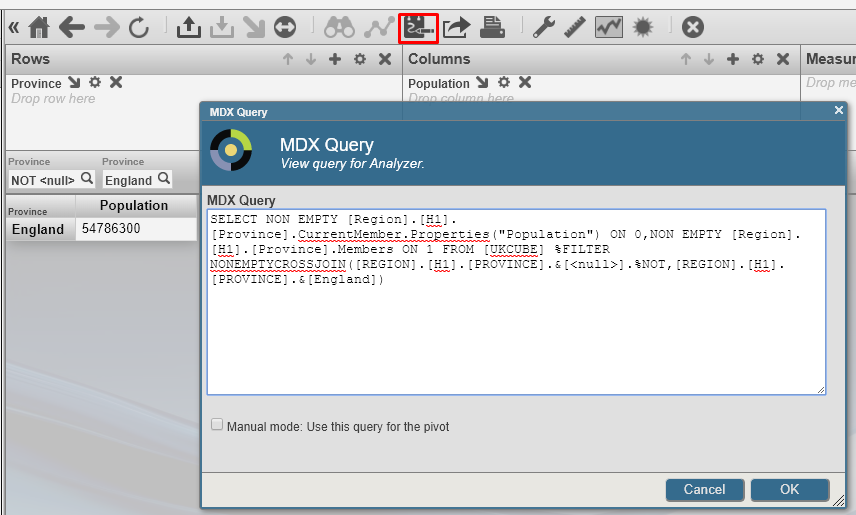
  • MDX can be composed manually, but we recommend doing it with the help of Analyzer, a built-in constructor from InterSystems IRIS BI/DeepSee. Analyzer

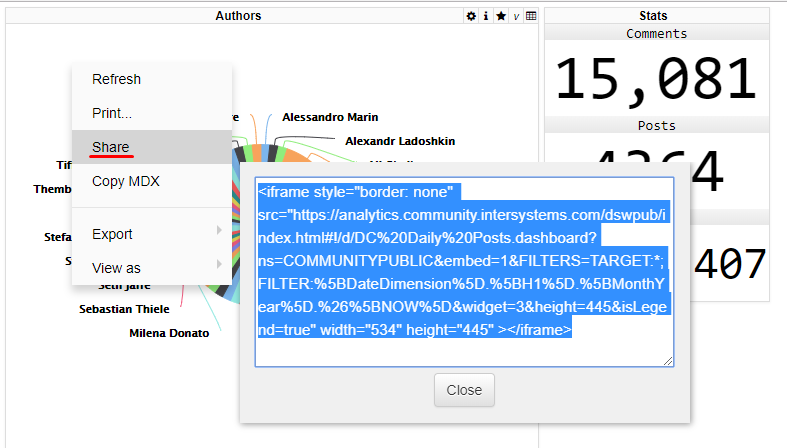
  • The URL value can be obtained from DeepSeeWeb. Widgets built into a report are iframe elements pulling data from DeepSeeWeb widgets. In order to get a link to the source, select “Share” from the widget’s context menu. Share

Report customization

Report libraries come with a file called style.css that enables you to customize the appearance of the report. It contains a standard set of classes controlling every element of the report. You can also add your own style classes and use them in the index.html file.

Emailing reports

Let’s assume that the report is ready and saved to the reports folder in DeepSeeWeb. It means that the interactive HTML report is now accessible via a link. So what do you need to do to convert it to PDF and email it? It can be done automatically by pthantomjs and the built-in SMTP client. More information about installing and configuring phantomjs can be found here (windows, ubuntu). After that, you will need to configure the SMTP client and create a task in the Task Manager.

SMTP settings

All settings are configured in the terminal.

  1. First, you need to configure your email settings
// SMTP configuration function
do ##class(DSW.Report.EmailSender).setConfig(server, port, username, password, sender, SSLConfig)
  • server — the SMTP server address.
  • port — the port for incoming messages.
  • username and password — authentication details.
  • sender — the sender’s email address.
  • SSLConfigOptional. The name of the SSL-configuration.
  1. You will then need to put together a list of recipients
// A function for adding a user
do ##class(DSW.Report.EmailSender).addRecipient(email)
// A function for removing a user
do ##class(DSW.Report.EmailSender).deleteRecipient(email)
  1. Once the previous steps are completed, you can start sending out emails
// A function that starts the email dispatch
do ##class(DSW.Report.Task).Run(url, reportname)
  • url — a link to the report.
  • reportname — the name of the report. Used for PDF generation.

Launching the automatic mailout

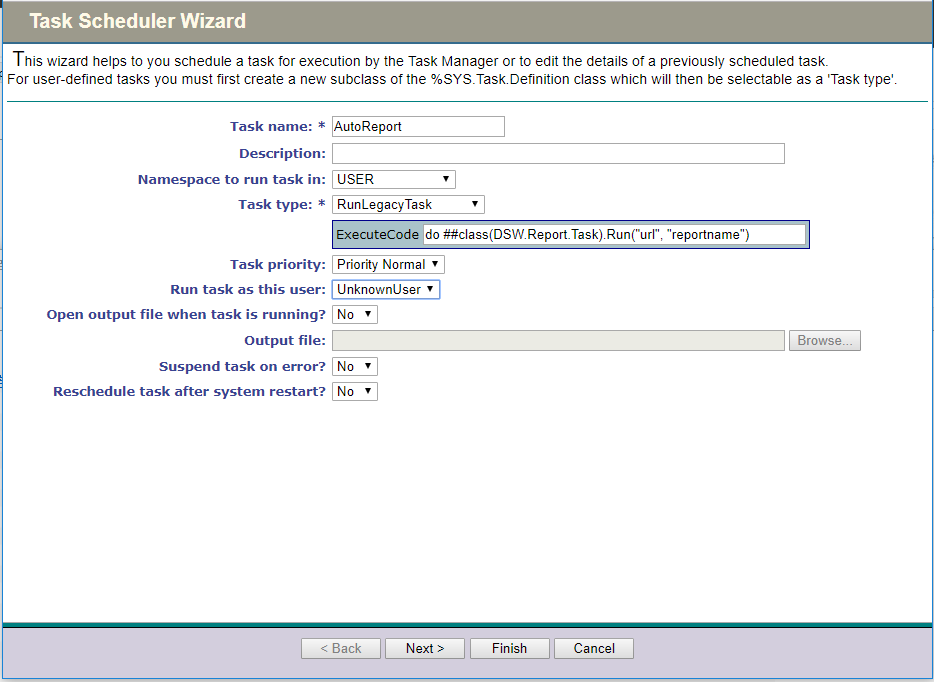
Let’s use the Task Manager to automate the mailout process. We need to create a new task with the following parameters:

  1. The first page lets you configure the namespace and specify the function for launching the mailout task. Task1

  2. You can configure the time and periodicity of task execution on the second page. Task2

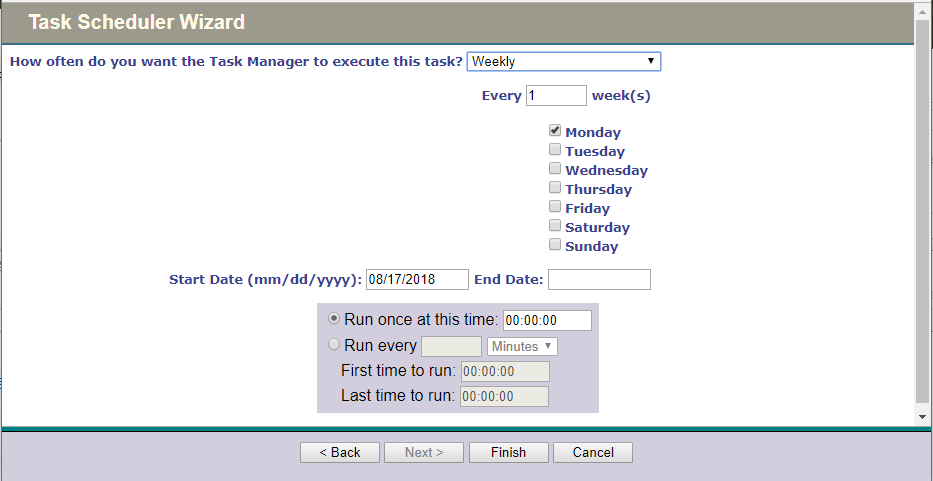
  3. The last step is to click the “Finish” button.

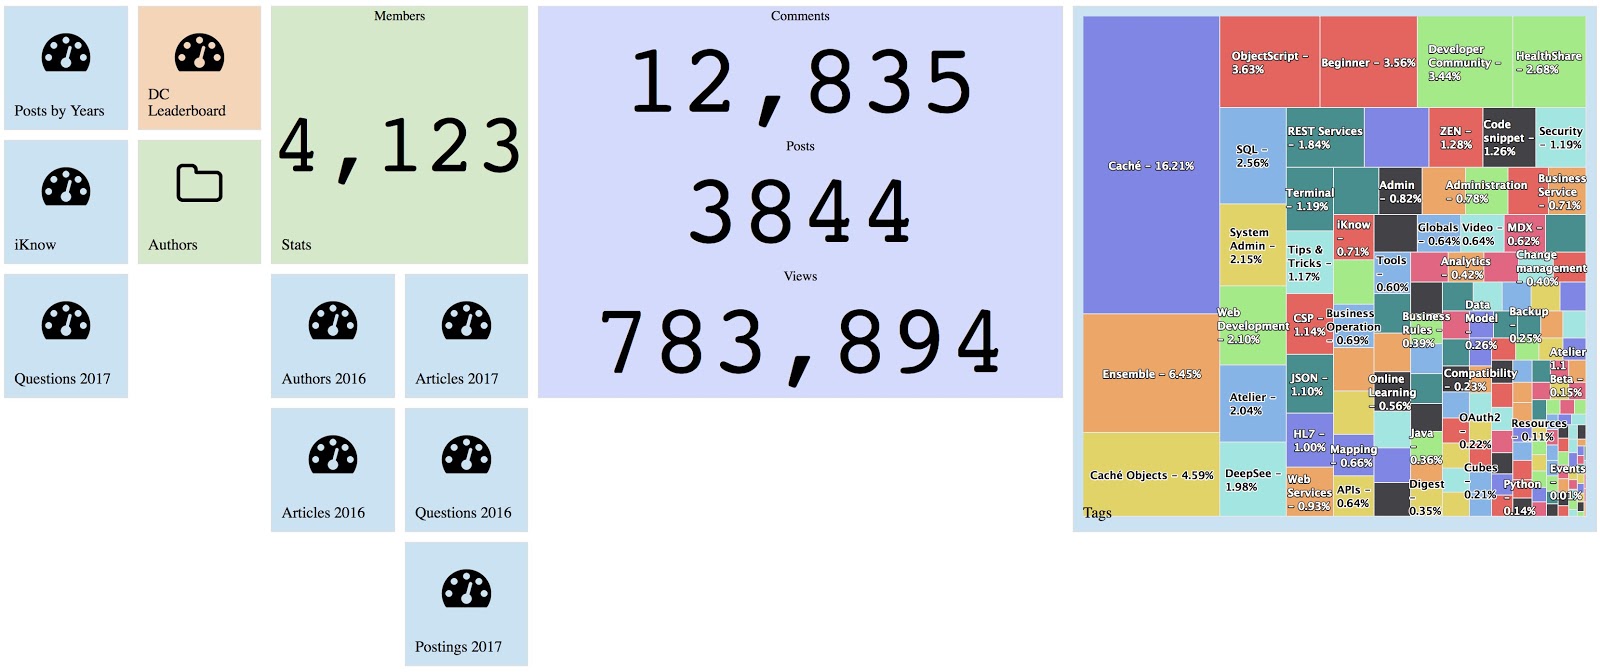
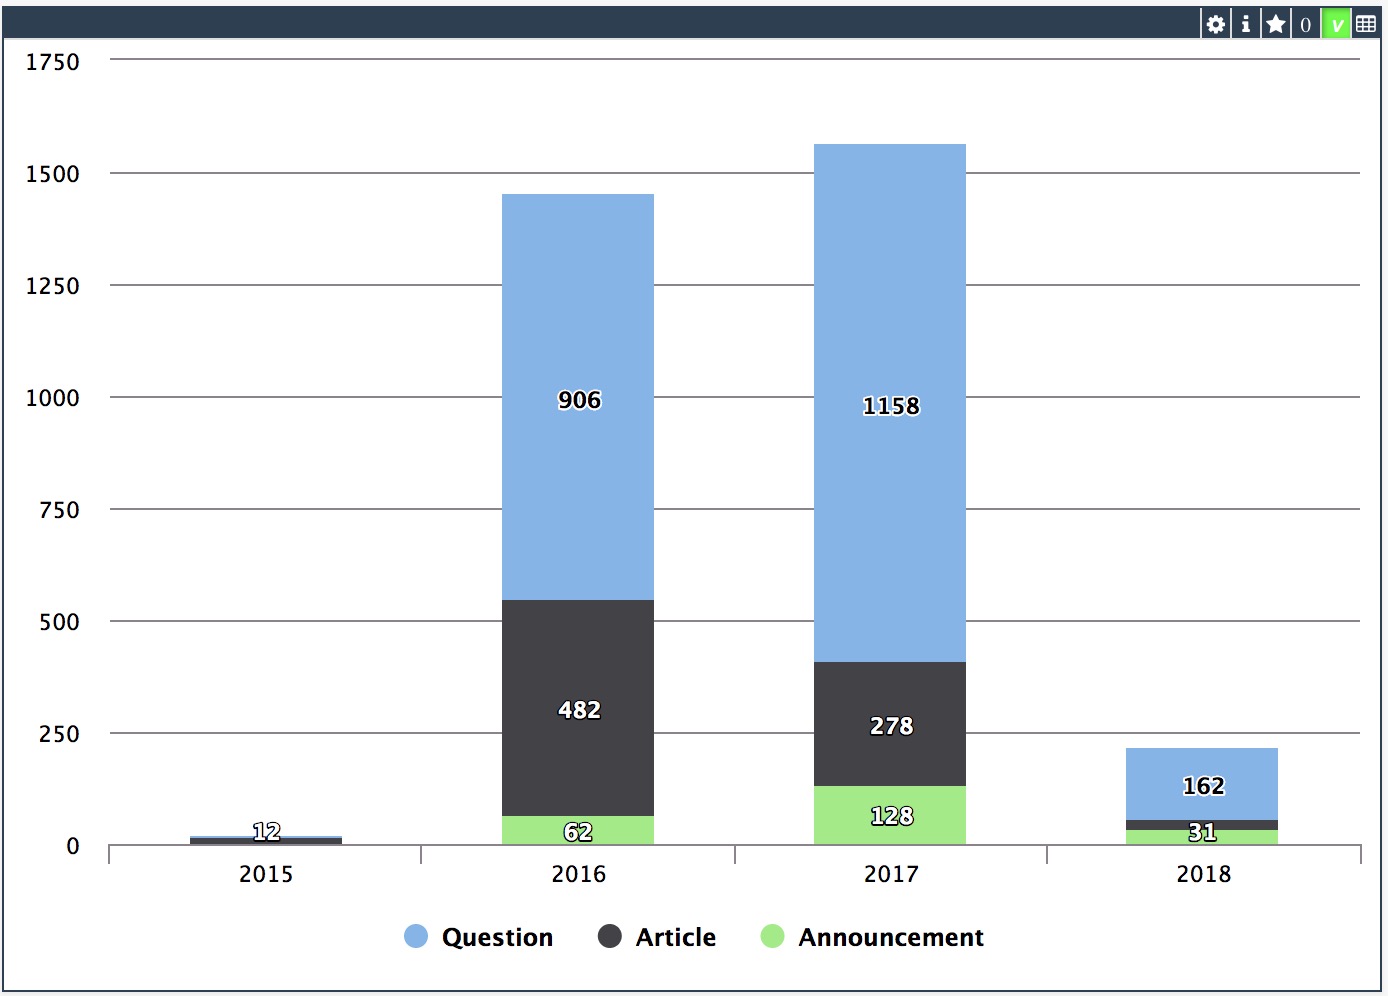
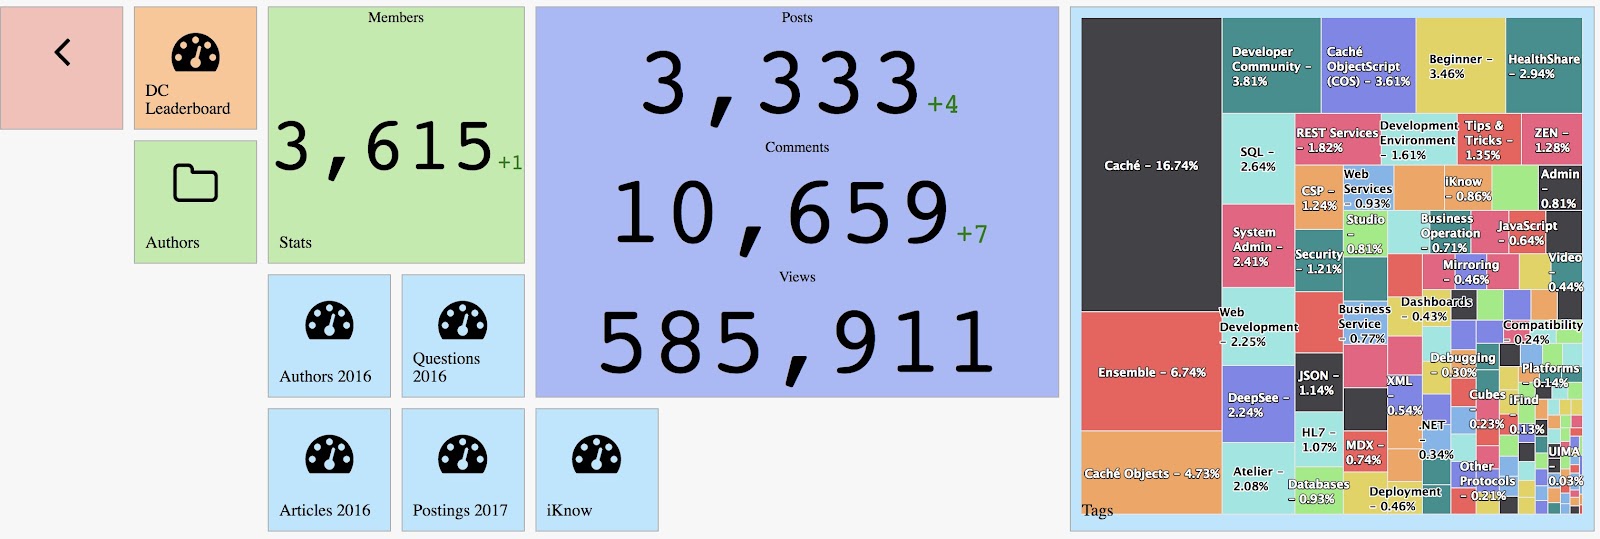
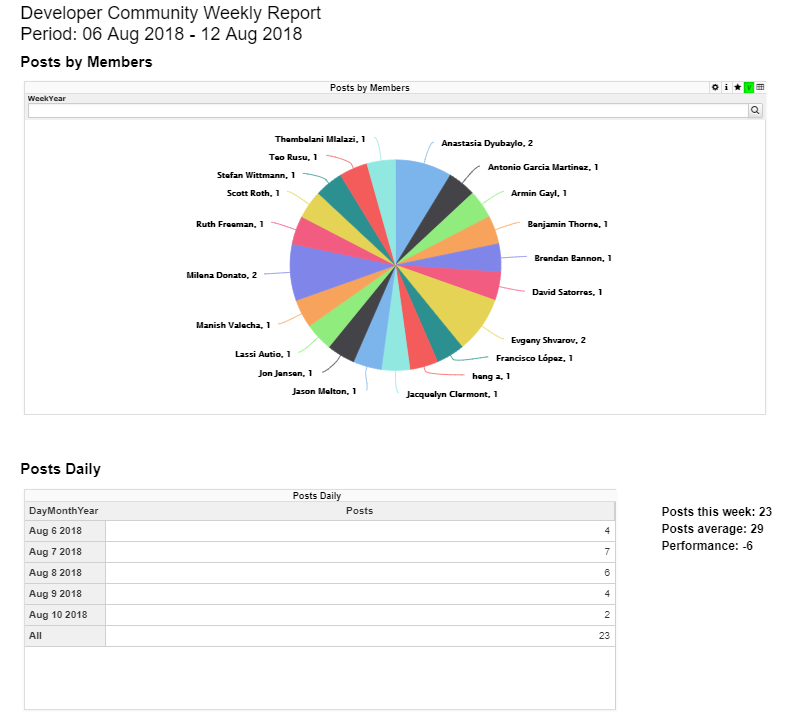
That’s it, with all of these manipulations behind us, we have an automatically generated report consisting of DeepSeeWeb widgets that is emailed in the PDF format at a particular time.

  • An example of a ready report can be found here
  • The configuration file for this report is here
  • Here you can subscribe to the weekly report delivery
  • Link to the repository
0
1 644
Article Niyaz Khafizov · Oct 8, 2018 16m read

Hi all. We are going to find duplicates in a dataset using Apache Spark Machine Learning algorithms.

Note: I have done the following on Ubuntu 18.04, Python 3.6.5, Zeppelin 0.8.0, Spark 2.1.1

Introduction

In previous articles we have done the following:

In this series of articles, we explore Machine Learning and record linkage.

0
1 749
Article Alessandro Marin · Apr 17, 2018 2m read

The following post outlines a more flexible architectural design for DeepSee. As in the previous example, this implementation includes separate databases for storing the DeepSee cache, DeepSee implementation and settings, and synchronization globals. This example introduces one new databases to store the DeepSee indices. We will redefine the global mappings so that the DeepSee indices are not mapped together with the fact and dimension tables.

1
0 674
Announcement Benjamin De Boe · Sep 4, 2018

We’re now less than a month away from our annual conference, the InterSystems Global Summit. This year, we’ll be descending on the beautiful outskirts of San Antonio, a city worth visiting for its wonderful river walkway and its 18th century Spanish Mission, even if it hadn’t been the location of this year’s InterSystems event. Leaving the tourist guidance to the tourist guides, let’s take a closer look at what the conference has in stock for you, including a dedicated post-summit symposium on AI and ML on Wednesday October 3!

0
0 335
Article Alessandro Marin · Aug 14, 2018 5m read

The source class of a DeepSee cube has a property referencing a different class:

Class ClassA Extends %Persistent {
     Property P1 As ClassB;
}

When records in class B change, the ^OBJ.DSTIME global for Class A will not be automatically updated. This means that synchronization of cubes based on source class A will not reflect the changes occurred to property P1.
This post will help you determine the best way to achieve synchronization of properties referencing a different class

2
2 546
Article Evgeny Shvarov · Mar 20, 2018 3m read

Hi, Community!

I’m sure you are using Developer Community analytics built with InterSystems Analytics technology DeepSee:

You can find DC analytics n InterSystems->Analytics menu.

DC Analytics shows interactive dashboards on key figures of DC entities: Posts, Comments, and Members. 

Since the last week, this analytics project is available for everyone with source code and data on DC Github!

1
1 670
Announcement Daniel Tamajon · May 21, 2018

As a developer, usually I'm concerned about how my code health is, and how the other coders code can affect to my own work.  And I'm quite sure most of us feel very similar.

In our company we use a Static Code Analysis tool to analyze code for different languages to ensure we are writing high quality and easily maintainable code by following a few best practices in terms of code structure and content. And the question was: why should be different for Caché ObjectScript language?

3
4 1200
Article Daniel Kutac · Jun 14, 2018 1m read

I was approached recently by and end use who wanted to perform analysis of their databases and see how they could save some space by picking data good for deletion without harming the application. As part of investigation, they wanted to know sizes of globals within datasets. This can be achieved by various means but all of them provide data in text form only.

I thought I might be a good tool for database administrators in general - to see global sizes in a graphical way.

1
0 402
Article Benjamin De Boe · Jan 31, 2018 4m read

With the release of InterSystems IRIS, we're also making available a nifty bit of software that allows you to get the best out of your InterSystems IRIS cluster when working with Apache Spark for data processing, machine learning and other data-heavy fun. Let's take a closer look at how we're making your life as a Data Scientist easier, as you're probably already facing tough big data challenges already, just from the influx of job offers in your inbox!

2
0 1767
Article Evgeny Shvarov · Feb 20, 2018 3m read

Hi, Community! 

This is the 3rd part of DeepSee Web story - Angular base UI for DeepSee Dashboards, see the beginning here.

By design, DSW provides an implementation for every widget in DeepSee library. But there are some extra features in DSW which make solutions built with DSW dashboards more functional.  This article describes it.

0
1 1058
Article Benjamin De Boe · Sep 19, 2017 4m read

Last week, we announced the InterSystems IRIS Data Platform, our new and comprehensive platform for all your data endeavours, whether transactional, analytics or both. We've included many of the features our customers know and loved from Caché and Ensemble, but in this article we'll shed a little more light on one of the new capabilities of the platform: SQL Sharding, a powerful new feature in our scalability story.

11
2 1762
Article Evgeny Shvarov · Nov 15, 2017 3m read

Hi, Community!

In the second part about DeepSee Web, I’ll describe what customization options you have with DSW.  

There are two types of customizations: widget customization and dashboard panel customization.

Example of dashboard customization on Developer Community analytics.

5
0 1090
Announcement Michelle Spisak · Oct 17, 2017

Learning Services Live Webinars are back! 

At this year’s Global Summit, InterSystems debuted InterSystems IRIS Data Platform™, a single, comprehensive product that provides capabilities spanning data management, interoperability, transaction processing, and analytics. InterSystems IRIS sets a new level of performance for the rapid development and deployment of data-rich and mission-critical applications. Now is your chance to learn more! 

1
0 615
Question Nicky Zhu · Oct 24, 2017

Hi guys,

I'm trying to immigrate some of my HealthInsight dashboards and pivot tables to another HS instance.

In some pivot tables, I defined them with a set of calculated dimensions defined in the analyzer, e.g as below:

Then when I exported the cubes and pivot tables in used to my new envirmonment. When I open my pivot tables again, the calculated dimensions are missing and hence my pivot tables no longer work:

Is there any way to export those calculated dimensions so that I can used them else where? 

6
0 494
Article David E Nelson · Mar 9, 2017 9m read

Apache Spark has rapidly become one of the most exciting technologies for big data analytics and machine learning. Spark is a general data processing engine created for use in clustered computing environments. Its heart is the Resilient Distributed Dataset (RDD) which represents a distributed, fault tolerant, collection of data that can be operated on in parallel across the nodes of a cluster. Spark is implemented using a combination of Java and Scala and so comes as a library that can run on any JVM. Spark also supports Python (PySpark) and R (SparkR) and includes libraries for SQL

5
1 2803
Question Steve Pisani · Oct 22, 2017

Hi,

I have a persistent class “sp.SensorReading” which has a number of Properties: Date, SensorName, SensorReading.   (sometimes multiple readings from the same sensor, on a given day)

...
Temp    28 Jan                    33.5
Temp    29 Jan                    31.2
Temp    30 Jan                    33.1
Temp    30 Jan                    34.1
Temp    31 Jan                    32.1
Temp    31 Jan                    33.1

12
0 442
Article Semion Makarov · Sep 10, 2017 2m read

System Monitor is a flexible and highly configurable tool supplied with Caché (Ensemble, HealthShare), which collects the essential metrics of the operating system and Caché itself. System Monitor also notifies administrators about issues with Caché and the operating system, when one or several parameters reach the admin-defined thresholds.

2
2 1493
Question Daniel Kutac · Aug 3, 2017

Hello,

I have a series of data organized by time (year and month) so I can use a time dimension to drill down data. So far so good.

However, I need to display the data not by calendar years and months but rather by seasons. The season has 12 calendar months but starts in September. So I'd like to see the data from September / Year N to August / Year N+1 using the same hierarchy as normal time dimension.

Has anyone done something similar?

Obviously, the season can start by any month, not only September :)

TIA!

3
0 335