Hey Community,
We want to hear from you! Give us your feedback on the past InterSystems Interoperability programming contest! Please answer some questions to help us improve our contests.
👉 Quick survey: InterSystems Interoperability Contest Survey

Contest tag unites posts that are related to any coding competition taking place on InterSystems Developer Community.
Hey Community,
We want to hear from you! Give us your feedback on the past InterSystems Interoperability programming contest! Please answer some questions to help us improve our contests.
👉 Quick survey: InterSystems Interoperability Contest Survey
Hey Developers,
It's time to announce the winners of the InterSystems Interoperability contest!
Thank you all for participating in our coding competition! And the winners are...

A storm of applause goes to these developers and their applications:
Hey Developers,
This week is a voting week for the InterSystems Interoperability contest! So, it's time to give your vote to the best solutions built with InterSystems IRIS.
🔥 You decide: VOTING IS HERE 🔥

How to vote? Details below.
Hi Developers!
Here're the technology bonuses for the InterSystems Interoperability Contest 2021 that will give you extra points in the voting:
See the details below.
Hi contestants!
We've introduced a set of bonuses for the projects for the Interoperability Contest 2021!
Here are projects that scored it:
I work as an Integration Engineer for United States Department of Veterans Affairs (VA). I work on a Health Connect production which processes many RecordMap files. I do not fully understand RecordMaps and I wanted to develop an application for the Interoperability contest where I could learn more about working with RecordMaps. I browsed InterSystems documentation for inspiration on how to start. I was happy to find CSV Record Wizard. I had created a CSV file for my Analytics contest entry. I wanted to use it to test the CSV Record Wizard. It was not obvious how to use it. The dialogue in
Hey Developers,
Welcome to the next InterSystems online programming competition:
🏆 InterSystems Interoperability Contest 🏆
Duration: October 04-24, 2021
Our prize pool increased to $9,450!
Hey Developers!
We're pleased to announce the next competition of creating open-source solutions using InterSystems IRIS or IRIS for Health! Please join:
⚡️ InterSystems Interoperability Contest ⚡️
Duration: November 2-22, 2020

Hi Community,
Join the upcoming InterSystems Interoperability Contest Kick-off Webinar dedicated to the Interoperability Contest.
In this webinar, you'll get an overview of the interoperability capabilities of InterSystems IRIS, and we'll show you how to use the PEX. Also, we’ll discuss and answer your questions on how to build interoperability solutions using InterSystems IRIS and IRIS for Health.
Date & Time: Monday, October 4 — 12:00 AM EDT
Speakers:
🗣 @Stefan Wittmann, InterSystems Product Manager
🗣 @Bob Kuszewski, InterSystems Product Manager
🗣 @Evgeny Shvarov, InterSystems Developer Ecosystem Manager
Hey Community,
We want to hear from you! Give us your feedback on the past InterSystems Analytics programming contest! Please answer some questions to help us improve our contests.
👉 Quick survey: InterSystems Analytics Programming Contest Survey

Hey Developers,
The InterSystems Analytics programming contest is over. Thank you all for participating in our coding competition!
So it's time to announce the winners!

A storm of applause goes to these developers and their applications:
Hi Community,
We're pleased to invite you to the online meetup with the winners of the InterSystems Analytics contest!
Date & Time: Friday, September 17, 2021 – 12:00 EDT
What awaits you at this virtual meetup?

Hello!
Want to get 5000 points on GlobalMasters?
I'm launching a bug bounty for a bug with which I've been struggling for the last 4 years. Have tried to resolve it many times, but no dice - can't track it down.
To claim this bounty you need to:
First come first serve. Bounty would be paid only ONCE for a first working solution.

I really love documentaries! Last weekend I was watching a Netflix documentary called This is Pop, because it was Analytics Contest time and I thought: Why not creating a pop song analytics with InterSystems Iris?
The first challenge was the database. I found on Data World project a CSV file with the Billboard hot 100 songs from 2000 to 2018, created by "Michael Tauberg" @typhon, that fits perfectly.
I was talking to @Henrique Dias and he gave me the idea of using Microsoft Power BI for good looking report with charts.
So let's analyze the data set, with a help of csvgen imported the CSV file.
The data set contains:
Title — Title of the song
Artist — Name of the Artist
Energy — The energy of the Song — higher the value, more energetic
Danceability — higher the value, easier it is to dance to the song
Loudness..dB.. — higher the value, louder the song.
Liveness — higher the value, more likely the song is a live recording.
Valence. — higher the value, more positive mood for the song.
Duration_ms. — The duration of the song in miliseconds.
Acousticness.. higher the value, more acoustic the song
Speechiness. — higher the value, more spoken word the song contains
Lyrics — Song lyric.
Genre — Musical Genre of Song.
On the CSV file the Genre is an array like this [u'dance pop', u'hip pop', u'pop', u'pop rap', u'rap']
My idea was to create a table for Genre and another table to solve the N:N relationship. A simple script on data populates this tables.
After that, just connect the Power BI on InterSystems Iris (here a step-by-step how to do that).
Next step: cool infographics.
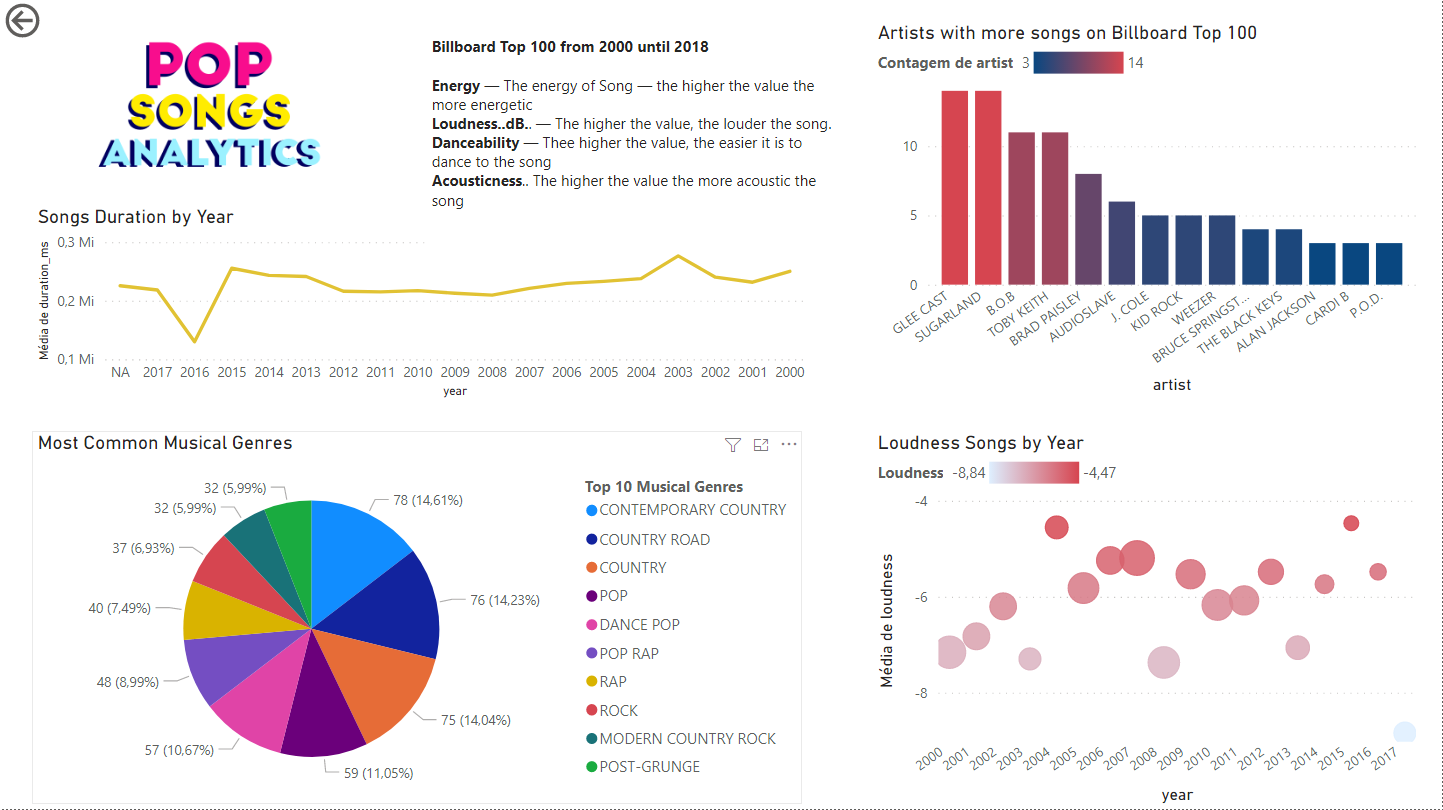
A bar chart to show the count of artists and a line chart for the average duration by year.
A pie chart with the most common genres, for my surprise, contemporary country was the most popular genre.
Has pop music gotten louder over the years? To answer that I use a Scatter plot with the average loudness by songs.
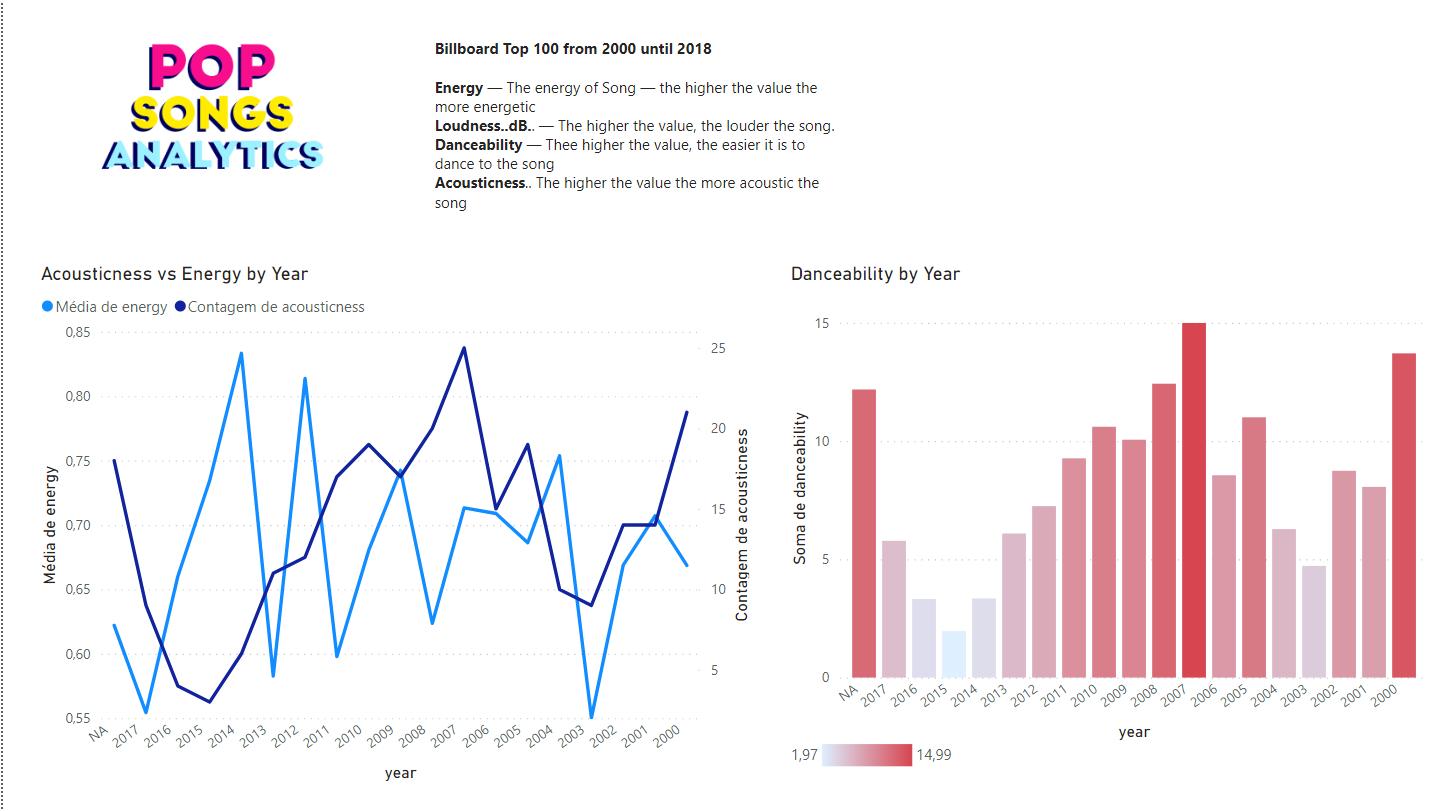
On the second page a bar chart shows how danceability changed by the years and a relation between energy versus acousticness.
If you liked the idea, please consider voting for the pop-songs-analytics
https://openexchange.intersystems.com/contest/current
Special thanks to @Henrique Dias for the nice chat and support.
Hey Developers,
This week is a voting week for the InterSystems Analytics contest! So, it's time to give your vote to the best solutions built with InterSystems IRIS.
🔥 You decide: VOTING IS HERE 🔥

How to vote? Details below.
Hi Developers!
We had a set of technology bonuses for the InterSystems IRIS Analytics contest.
And here is how projects collected it:
Hey Developers,
Welcome to the next InterSystems online programming competition:
🏆 InterSystems IRIS Analytics Contest 🏆
Duration: August 23 - September 12, 2021
Total prize: $8,750
Landing page: https://contest.intersystems.com

Hi Developers!
Here're the technology bonuses for the InterSystems Analytics contest that will give you extra points in the voting.
Adaptive Analytics (AtScale) Cubes usage - 4 points
InterSystems Adaptive Analytics provides the option to create and use AtScale cubes for analytics solutions.
You can use the AtScale server we set up for the contest (URL and credentials can be collected in the Discord Channel) to use cubes or create a new one and connect to your IRIS server via JDBC.
The visualization layer for your Analytics solution with AtScale can be crafted with Tableau, PowerBI, Excel, or Logi.
Hi Community,
We are pleased to invite all the developers to the upcoming InterSystems Analytics Contest Kick-off Webinar! The topic of this webinar is dedicated to the Analytics contest.
On this webinar, we’ll demo AtScale, InterSystems Reports (Logi), IRIS BI, IRIS NLP and answer the questions on how to develop, build, and deploy Analytics applications using InterSystems IRIS.
Date & Time: Monday, August 23 — 10:00 AM EDT
Speakers:
🗣 @Carmen Logue, InterSystems Product Manager - Analytics and AI
🗣 @Evgeny Shvarov, InterSystems Developer Ecosystem Manager
Hey Developers,
Are you ready for the new challenge? We're pleased to announce the first InterSystems technical article writing competition:
🏆 InterSystems Tech Article Contest 🏆
Write an article on any topic related to InterSystems technology from July 15 to August 15August 22 – extended!
Prizes for everyone: Everyone who publishes an article on DC during this period will receive a special prize pack!
Main Prize: Apple iPad

Join our new contest and your content will be seen by over 55K monthly readers! Details below.
Hi developers!
How to build an analytics solution with InterSystems IRIS?

To begin with, let's agree on the points of what is the analytics solution - and this could be a very wide topic. Let's limit the set of solutions to those you can present in the Analytics contest.
There are three kinds of analytics solutions that we will review here: monitoring, interactive analytics, and reporting.
Monitoring
The typical monitoring solution consists of an online dashboard with KPIs that are being actively updated.
The key use case is of monitoring is to visually observe the KPI of fresh data every moment to react in case of an emergency.
Interactive Analytics
This solution supposes a set of interactive dashboards with filters and drill-downs.
The key use case is to explore the data with filters and drill-downs making business decisions upon graph and table data visualization.
Reporting
Reporting solution provides a set of static (usually) reports in a form of HTML or pdf documents that deliver the data in graph and text form in a predesigned form and could be sent via email.
The typical use case of a reporting system is to obtain reports on a given period that will illustrate the status of the product, process, service, sales, etc that is crucial for the business.
How InterSystems products could be used to build such solutions? Let's discuss this below!
Hi Community,
We're pleased to invite you to the online meetup with the winners of the InterSystems AI contest!
Date & Time: Friday, July 30, 2021 – 11:00 AM EDT
What awaits you at this Virtual Meetup?
Hey Community,
We want to hear from you! Give us your feedback on the past InterSystems AI programming contest! Please answer some questions to help us improve our contests.
👉 Quick survey: InterSystems AI Programming Contest Survey

Hey Developers,
The InterSystems AI programming contest is over. And now it's time to announce the winners!
Are you excited?

A storm of applause goes to these developers and their applications:
Hi Developers!
We had a set of technology bonuses for the InterSystems AI/ML contest.
And here is how projects collected it:
Hey Developers,
This week is a voting week for the InterSystems AI programming contest! So, it's time to give your vote to the best solutions built with InterSystems IRIS.
🔥 You decide: VOTING IS HERE 🔥

How to vote? Details below.
I'm pleased to announce a major release of the InterSystems Server Manager extension. It has gained a UI!

Read more at Open Exchange.
Right now version 2.0 is like an aircraft at the start of the runway (remember those days before COVID-19?), waiting for the control tower to give final clearance. Will you be an early adopter, downloading the VSIX from GitHub, installing it into your VS Code, and posting back here to confirm that we haven't left anything critical behind at the gate? Then I'll push the throttles forward, publish to Marketplace, and we'll all be on our way.
Server Manager 2.0 is my entry for the current contest. If you like it maybe you'll vote for me it. ![]()
Hey Developers,
We're pleased to announce the next InterSystems online programming competition:
🏆 InterSystems AI Programming Contest 🏆
Duration: June 28 - July 25, 2021
Total prize: $8,750
Landing page: https://contest.intersystems.com

Hi Developers!
Here're the technology bonuses for the InterSystems IRIS AI contest that will give you extra points in the voting.
Use InterSystems IntegratedML in you AI/ML solution. Here is the template that uses it.
Be sure that the IRIS version is not less than 2021. The latest ML images with ZPM are:
intersystemsdc/iris-ml-community:2021.1.0.215.0-zpm
intersystemsdc/irishealth-ml-community:2021.1.0.215.0-zpm
R Gateway and Python gateway usage - 4 points
InterSystems IRIS 2021 release contains two new features - R gateway and Python gateway. Here is the template on how to use the R gateway. Here is a short demo of how to use it.
Embedded Python usage - 4 points
Embedded Python is a very new feature of InterSystems IRIS that gives you the option to use python as a "first-class citizen" in backend business logic development with InterSystems classes. Short demo of Embedded Python.
Embedded python could be used in "on-demand" images that could be delivered via InterSystems Early Access Program (EAP) if you refer to python-interest@intersystems.com.
Here is the template package on how to use Embedded Python deployable with ZPM. Don't forget to change the image to the one you get from the Early Access program.
PMML usage - 4 points
PMML - Predictive Modelling Markup Language - can be used to build AI/ML solutions with InterSystems IRIS. Check with documentation.
There is an example in Open Exchange on how to use PMML.
